Hands-On Observability
Introduction
The Customer Digital Experience use case covers the functionalities of Cisco ThousandEyes and integration with Cisco AppDynamics to illustrate how you can assess the application as experienced by end-users located around the world.
Troubleshooting Customer Digital Experience
Cisco ThousandEyes enhances troubleshooting of customer digital experiences through synthetic testing, path visualization, and the correlation of metrics for comprehensive performance analysis.
Follow the process in login to ThousandEyes to access the ThousandEyes platform.
Transaction View
ThousandEyes transaction (synthetic) tests simulate user interactions with web applications, like online Tea shopping, through scripted sequences.
Use the steps below to open the Transaction view in Cisco ThousandEyes.
- Click on the Cloud & Enterprise Agents and then Views on the left menu
- Select the Tea-Store-Transaction-LT test from the drop-down
- If not already selected, click the Transaction view
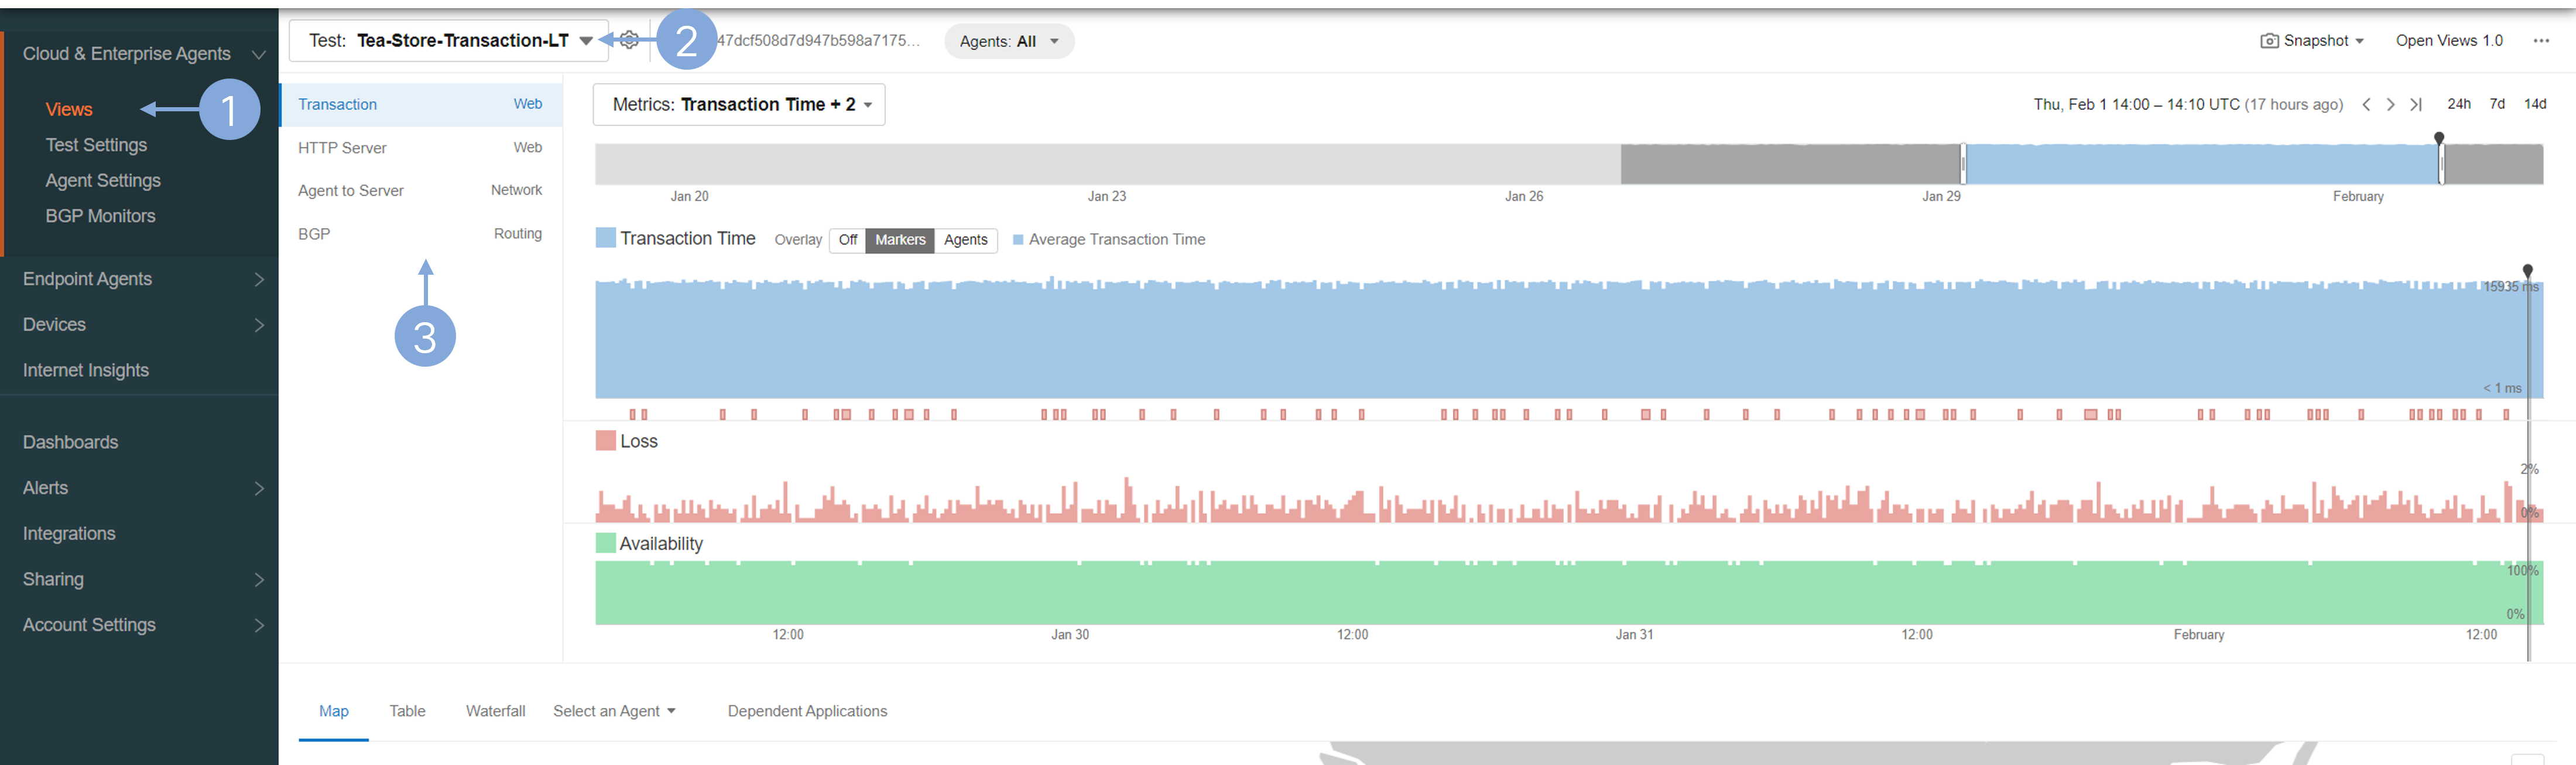
Note: For details on configuring the transaction test and the Selenium script utilized, navigate to Test Settings.
The Transaction Time view provides the average completion time for the transaction test across all selected agents.
Adjust the view by selecting the metrics you want to compare with.
- Click the Metrics drop-down
- Select the metrics you want to compare Transaction time with, e.g. Network Loss, Latency, Jitter.
- You can expand or shrink the time range you’re examining and then compare the metrics.
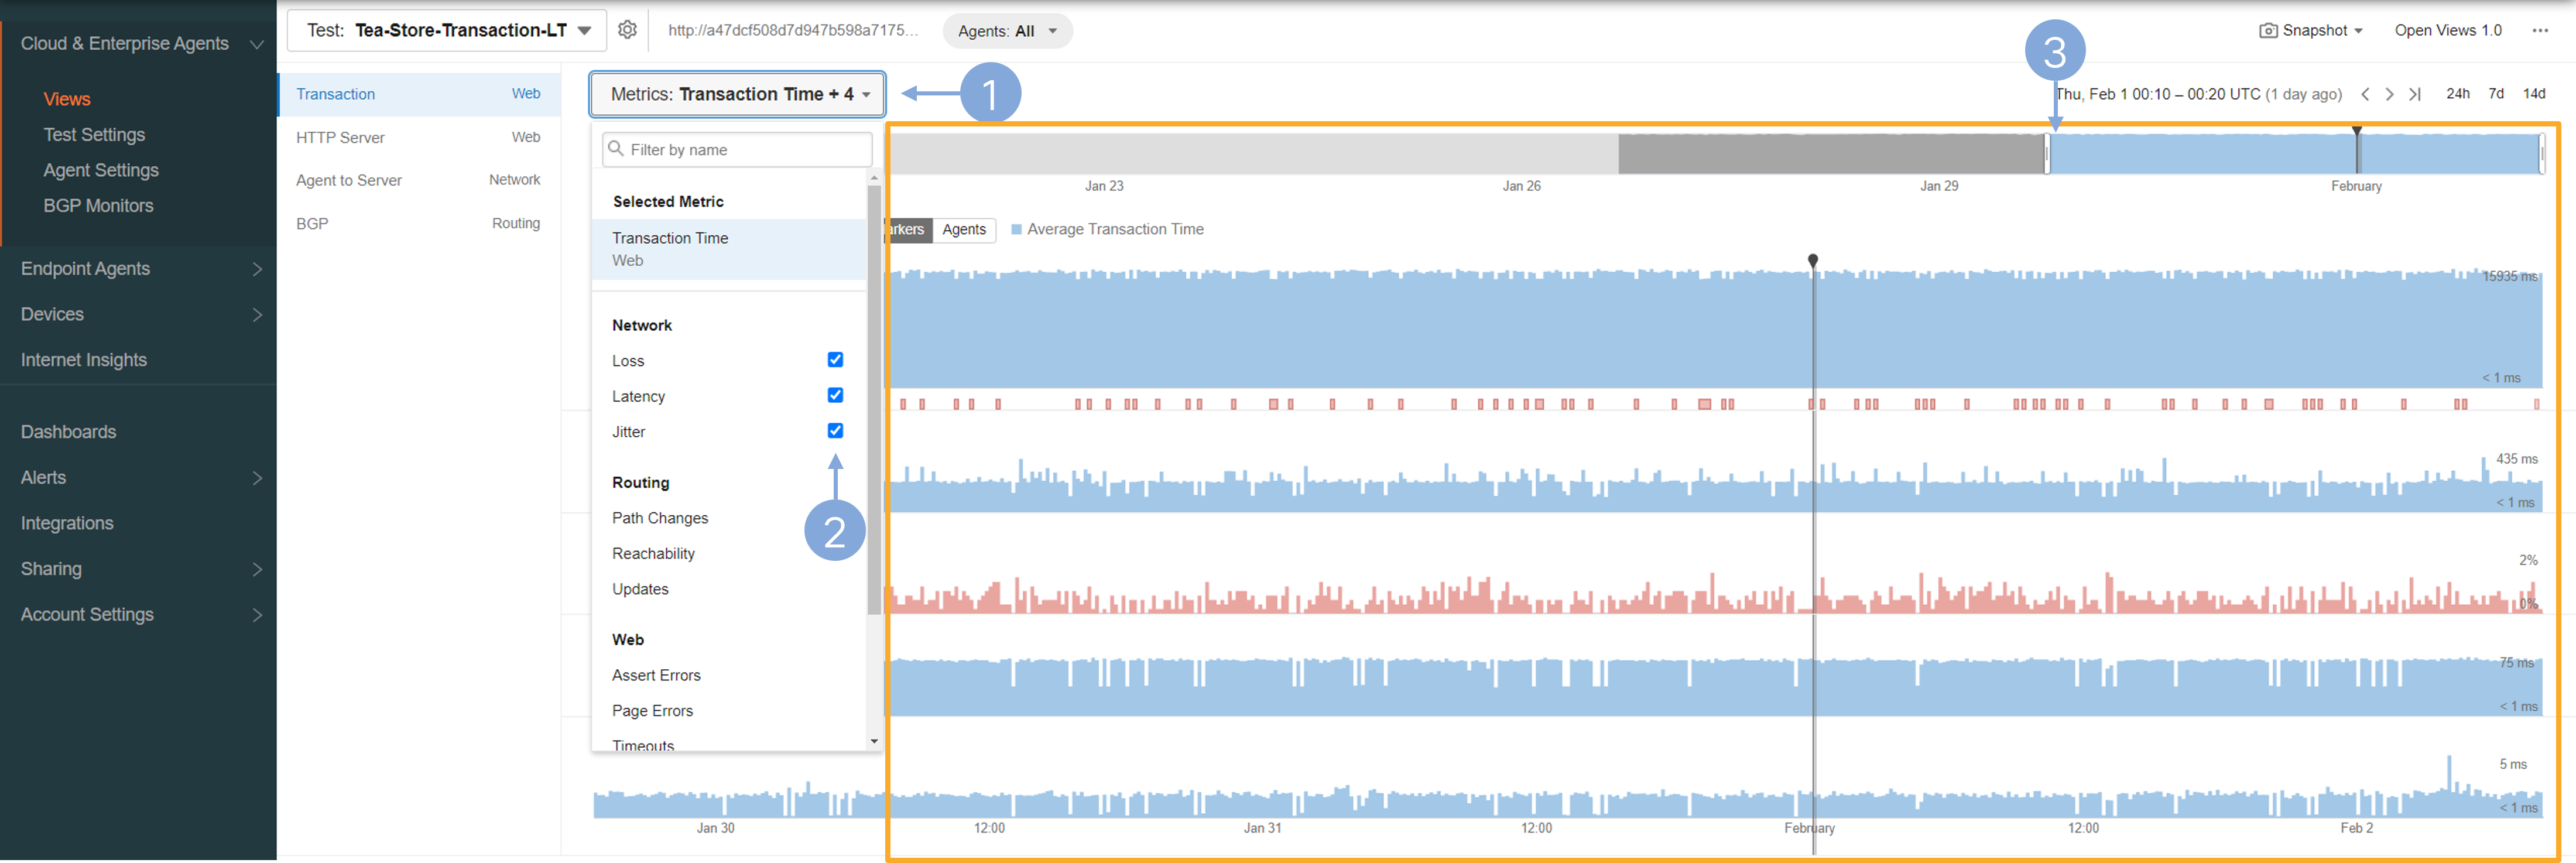
Are there any noticeable increases or unusual patterns in the data during this period?
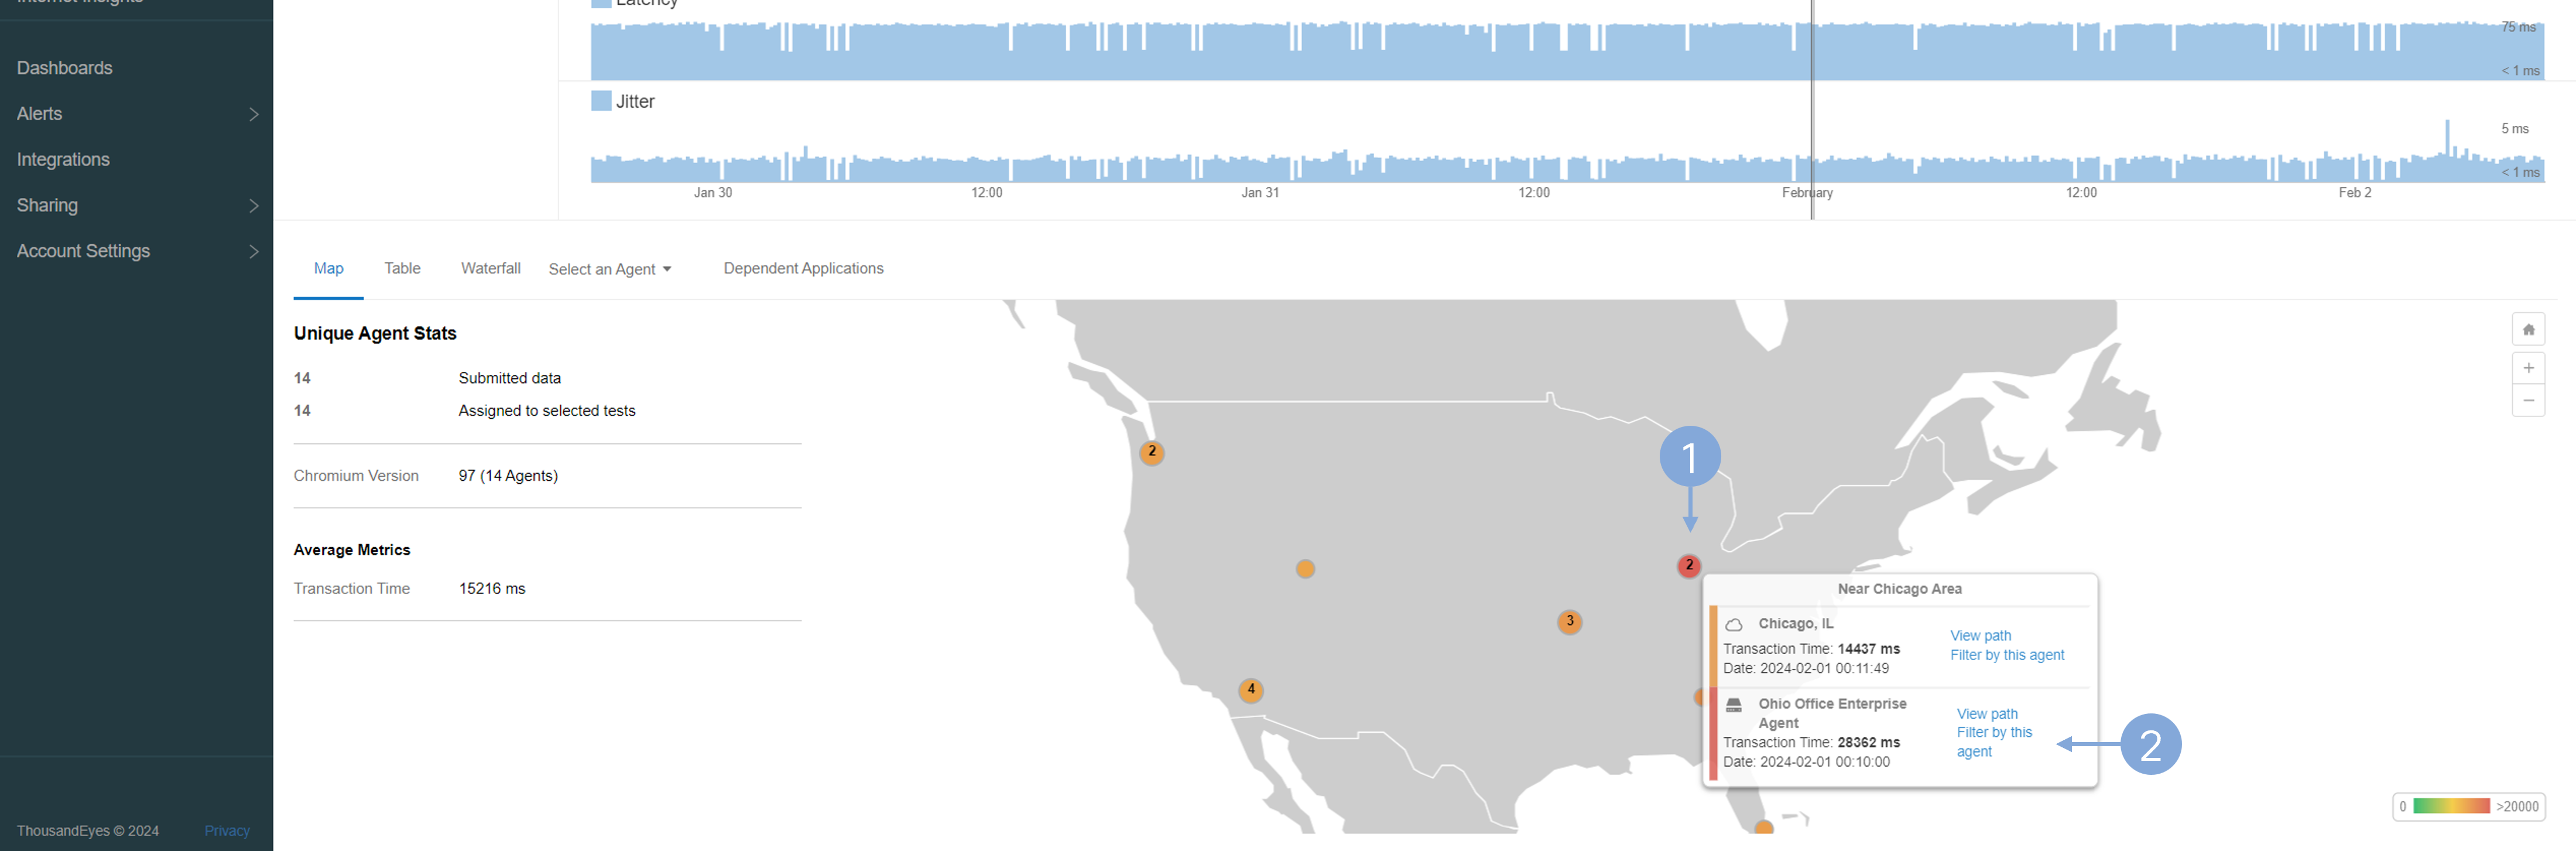
Scroll down and inspect the Map view.
- Click the Metrics drop-down
- Select the metrics you want to compare Transaction time with, e.g. Network Loss, Latency, Jitter.
- You can expand or shrink the time range you’re examining and then compare the metrics.
Are there any noticeable increases or unusual patterns in the data during this period?
Scroll down and inspect the Map view.
- On the map, hover over agent locations near Chicago area.
- The Ohio Office Enterprise Agent shows significantly longer transaction times relative to other locations. To isolate this data, click on Filter by this Agent next to the specified agent.
Scroll upwards to view the metric data now filtered to highlight the problematic location.
- Note the selected agent.
- Move your cursor over the metrics display. You’ll observe a notably increased transaction time, alongside a significant loss of TCP packets.
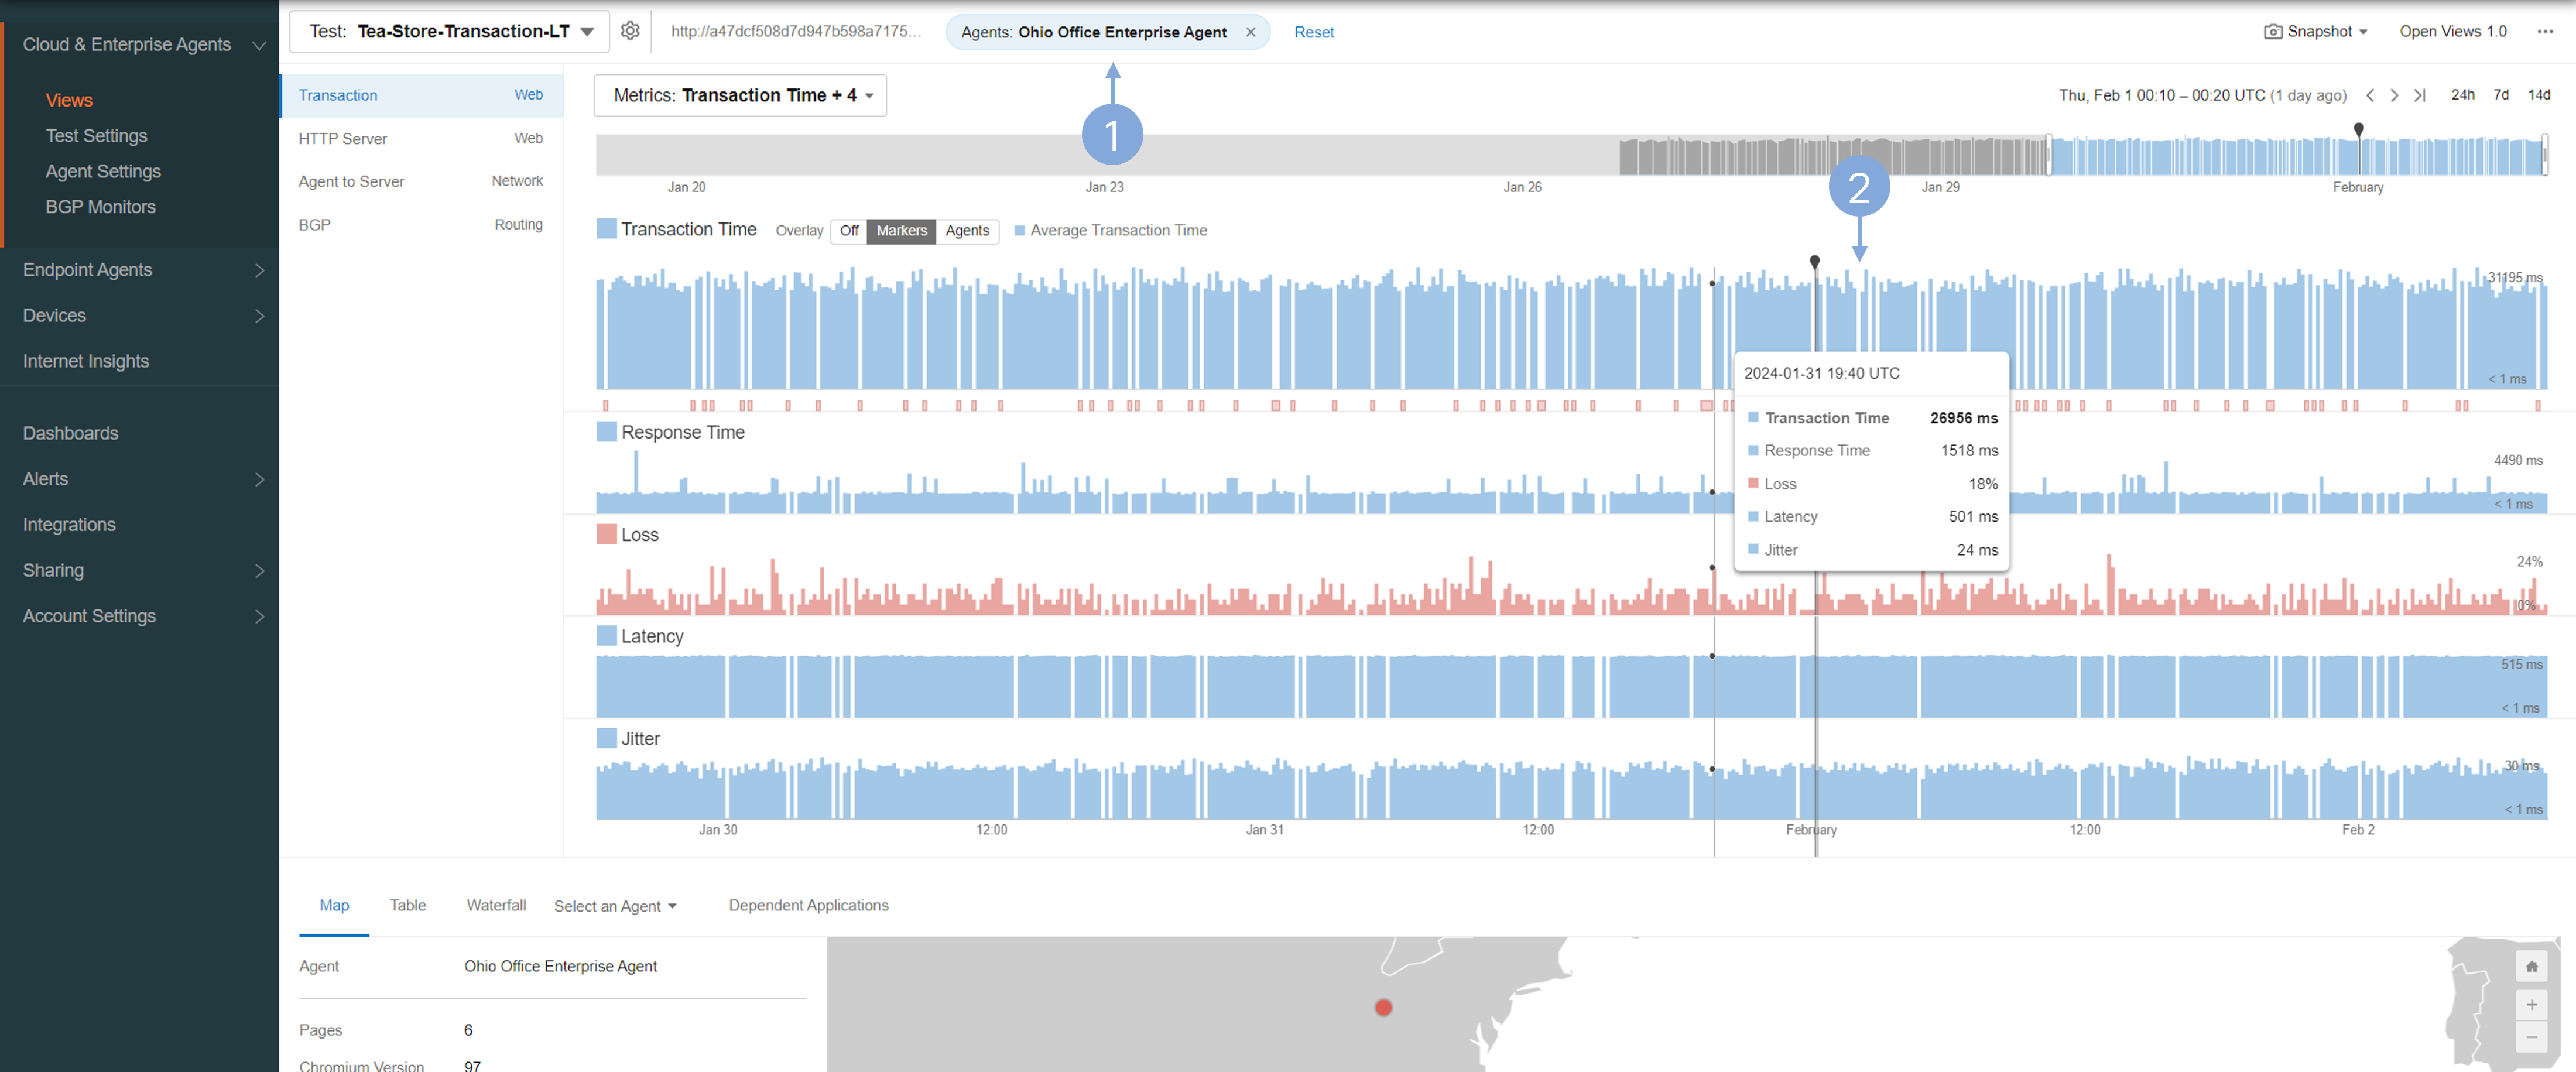
Lets continue our investigation down the layers.
HTTP Server View
The HTTP Server View in ThousandEyes provides a detailed analysis of server response times and performance metrics for web applications, enabling precise monitoring of HTTP services.
Inspect the HTTP Server view.
- Click HTTP Server view.
- Inspect the response times within the selected timeframe, alongside response timing into DNS lookup connect, wait, and SSL negotiation times.
- If you hover over the chart, individual timing averages are displayed.
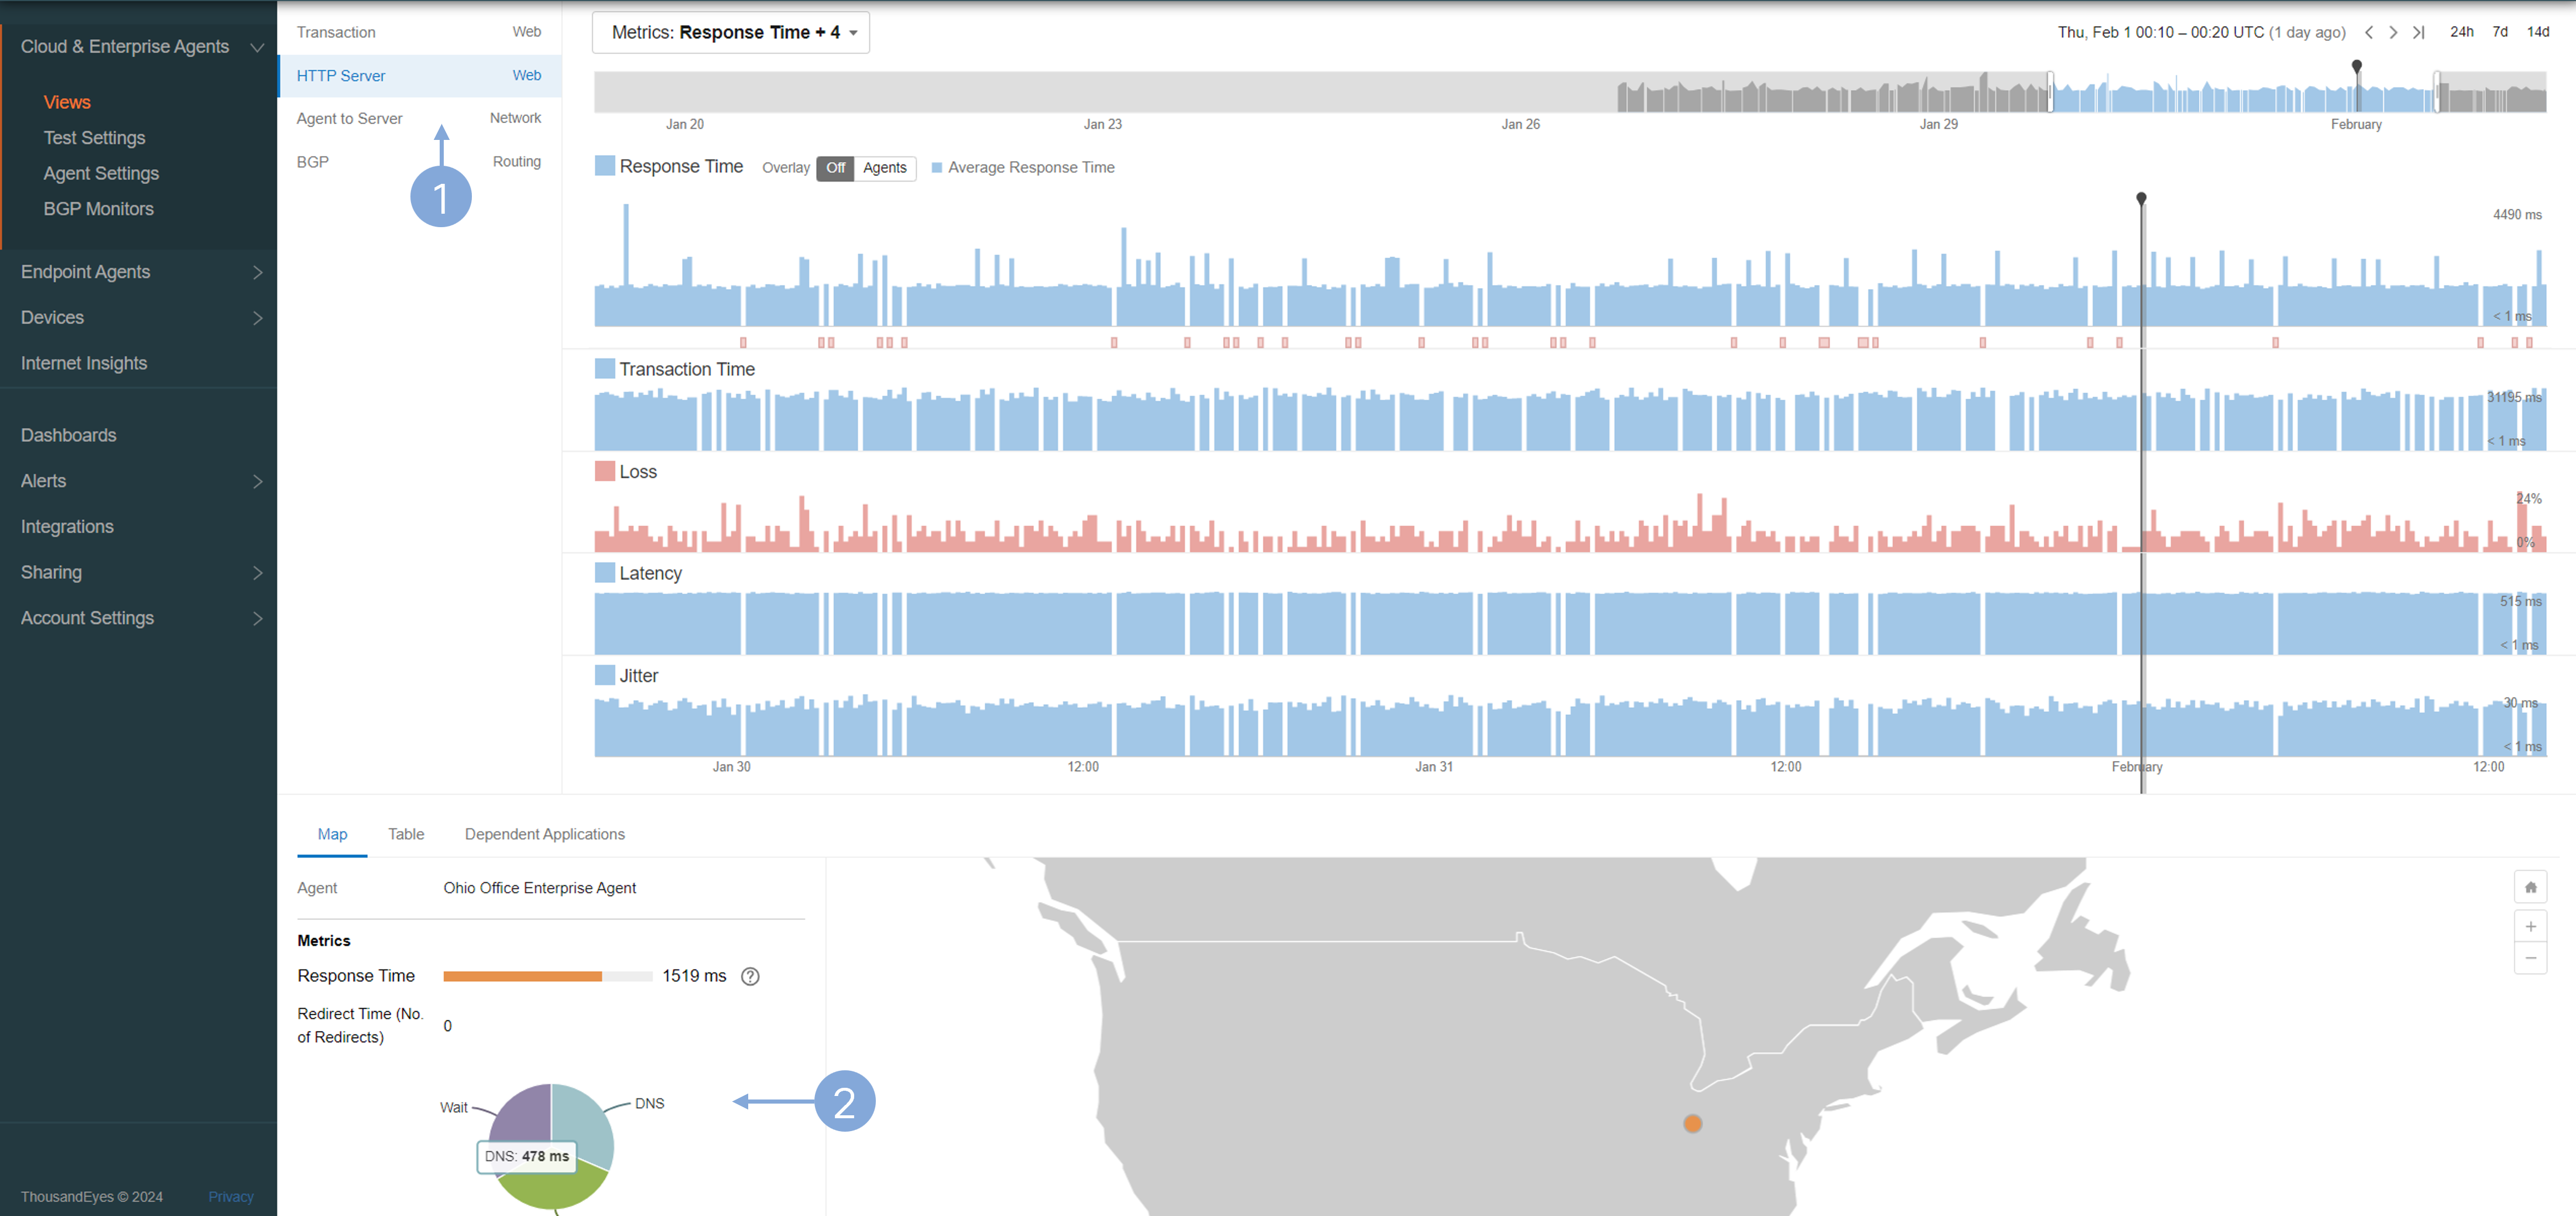
Are there any noticeable increases or unusual patterns in the data during this period?
Next, lets look into the Network layer.
Agent to Server View
The Agent to Server View in ThousandEyes provides a visual analysis of the network path and performance metrics between testing agents and target servers, facilitating in-depth network troubleshooting.
Inspect the Agent to Server view.
- Click Agent to Server view.
- Inspect the network metrics such as Loss, Latency, and Jitter
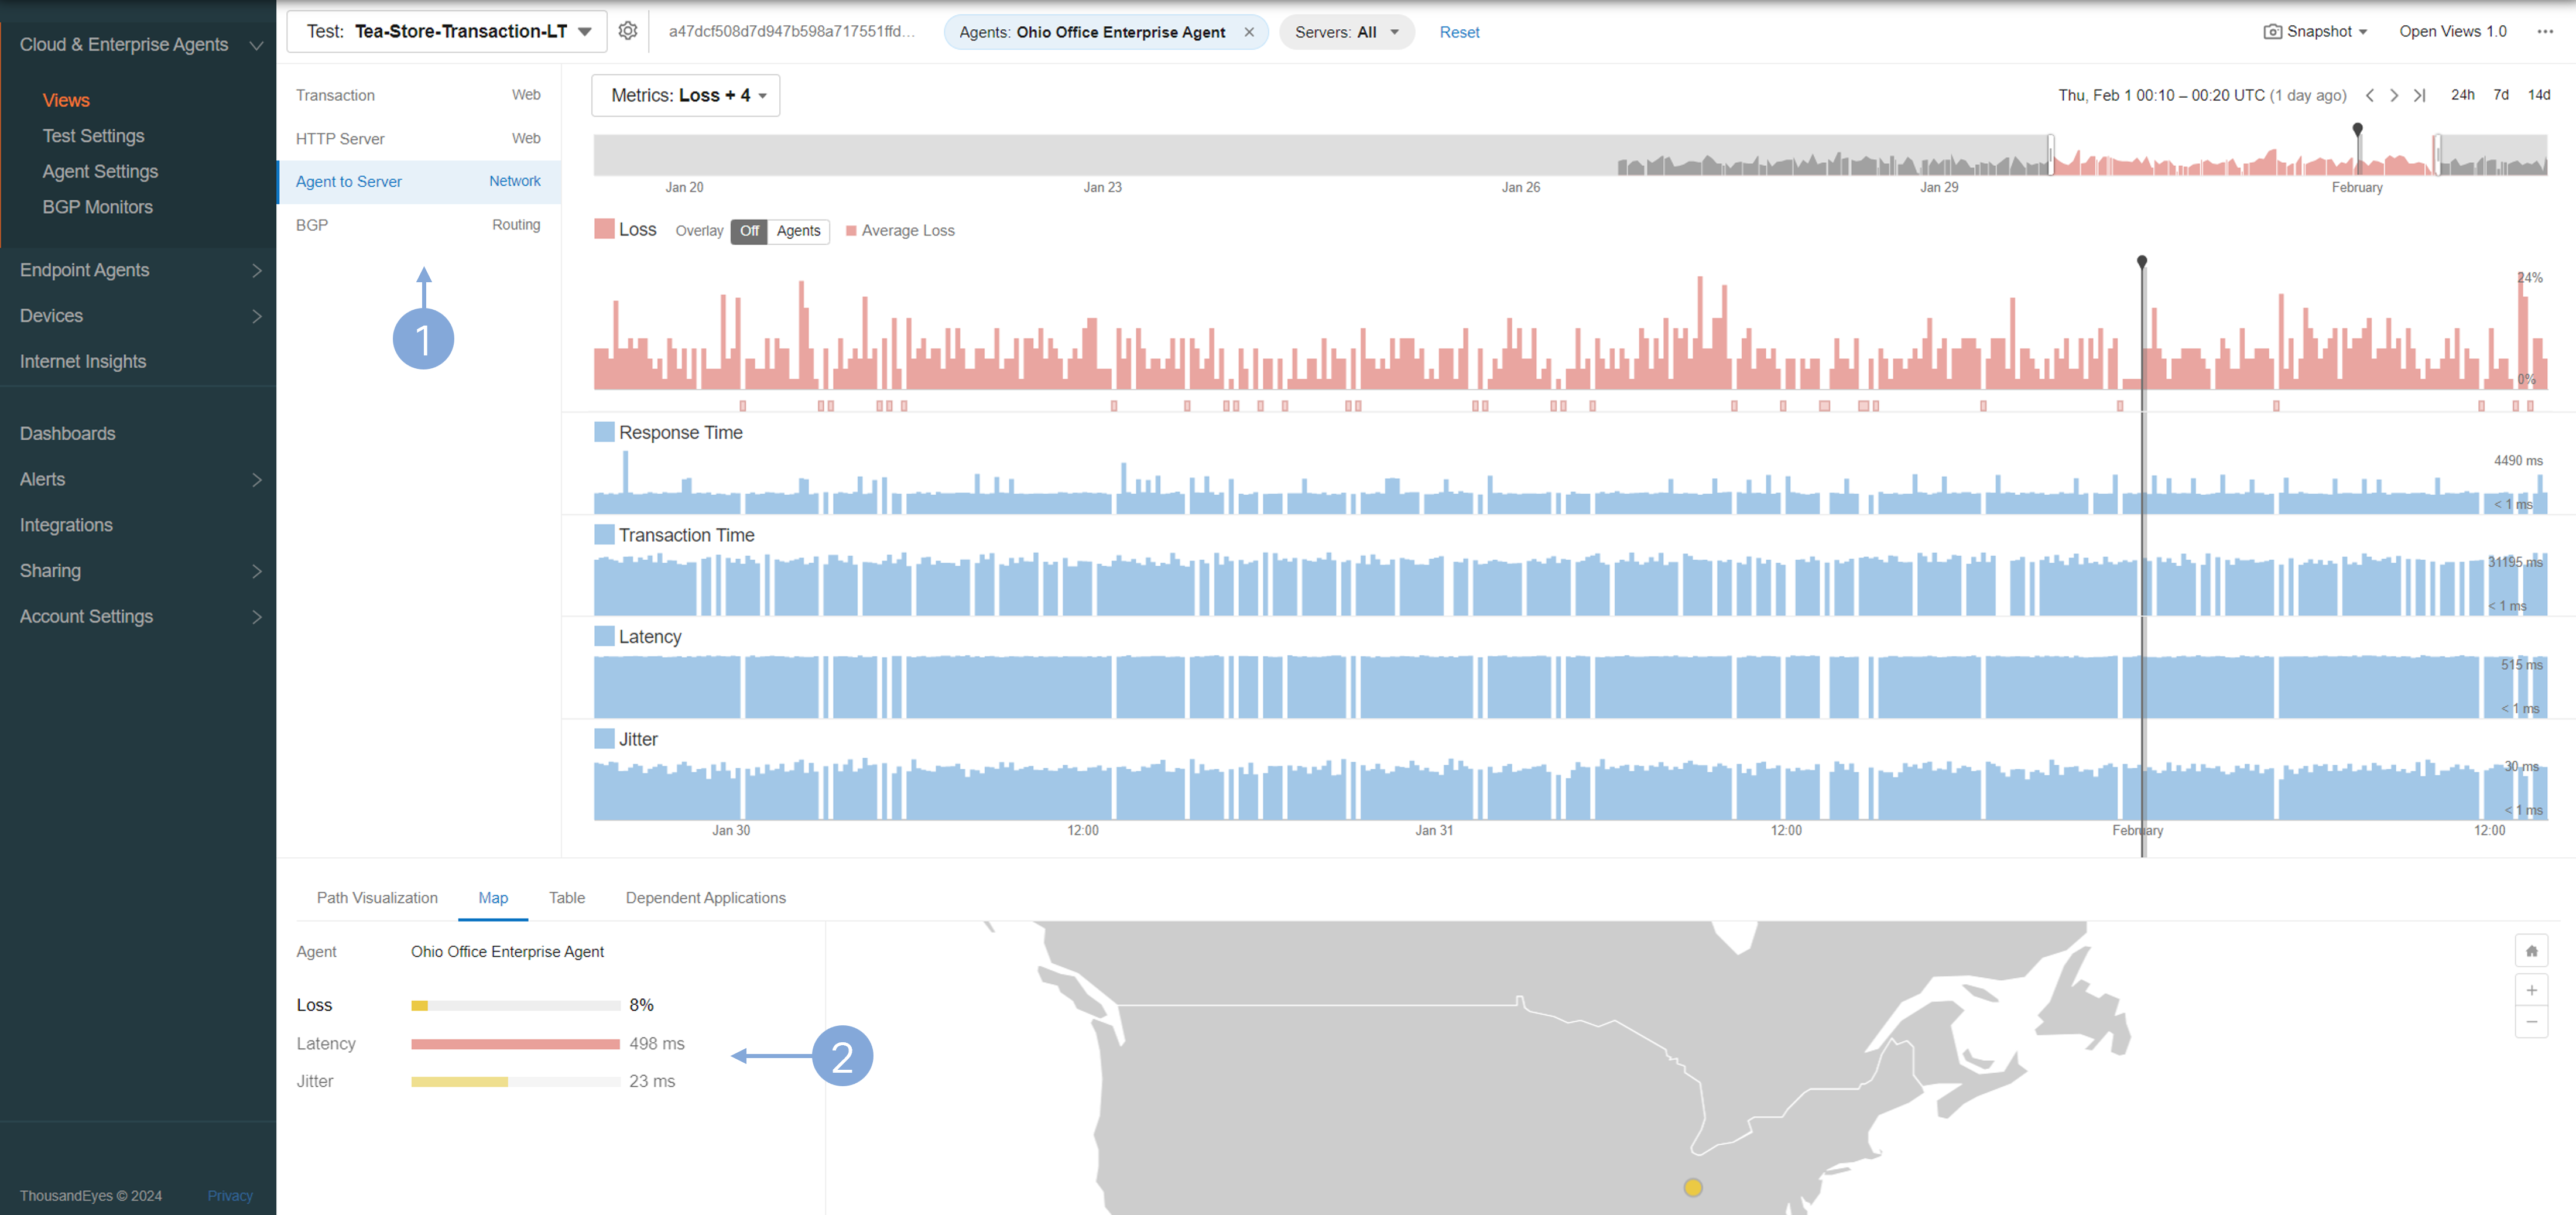
Does any of these metrics stand out?
Inspect the Path Visualization.
- Click Path Visualization tab.
- Lower the Link Delay until you see some issues on the path.
- Select one of the problematic (red) links and inspect the details.
- Also see the source and destination nodes.
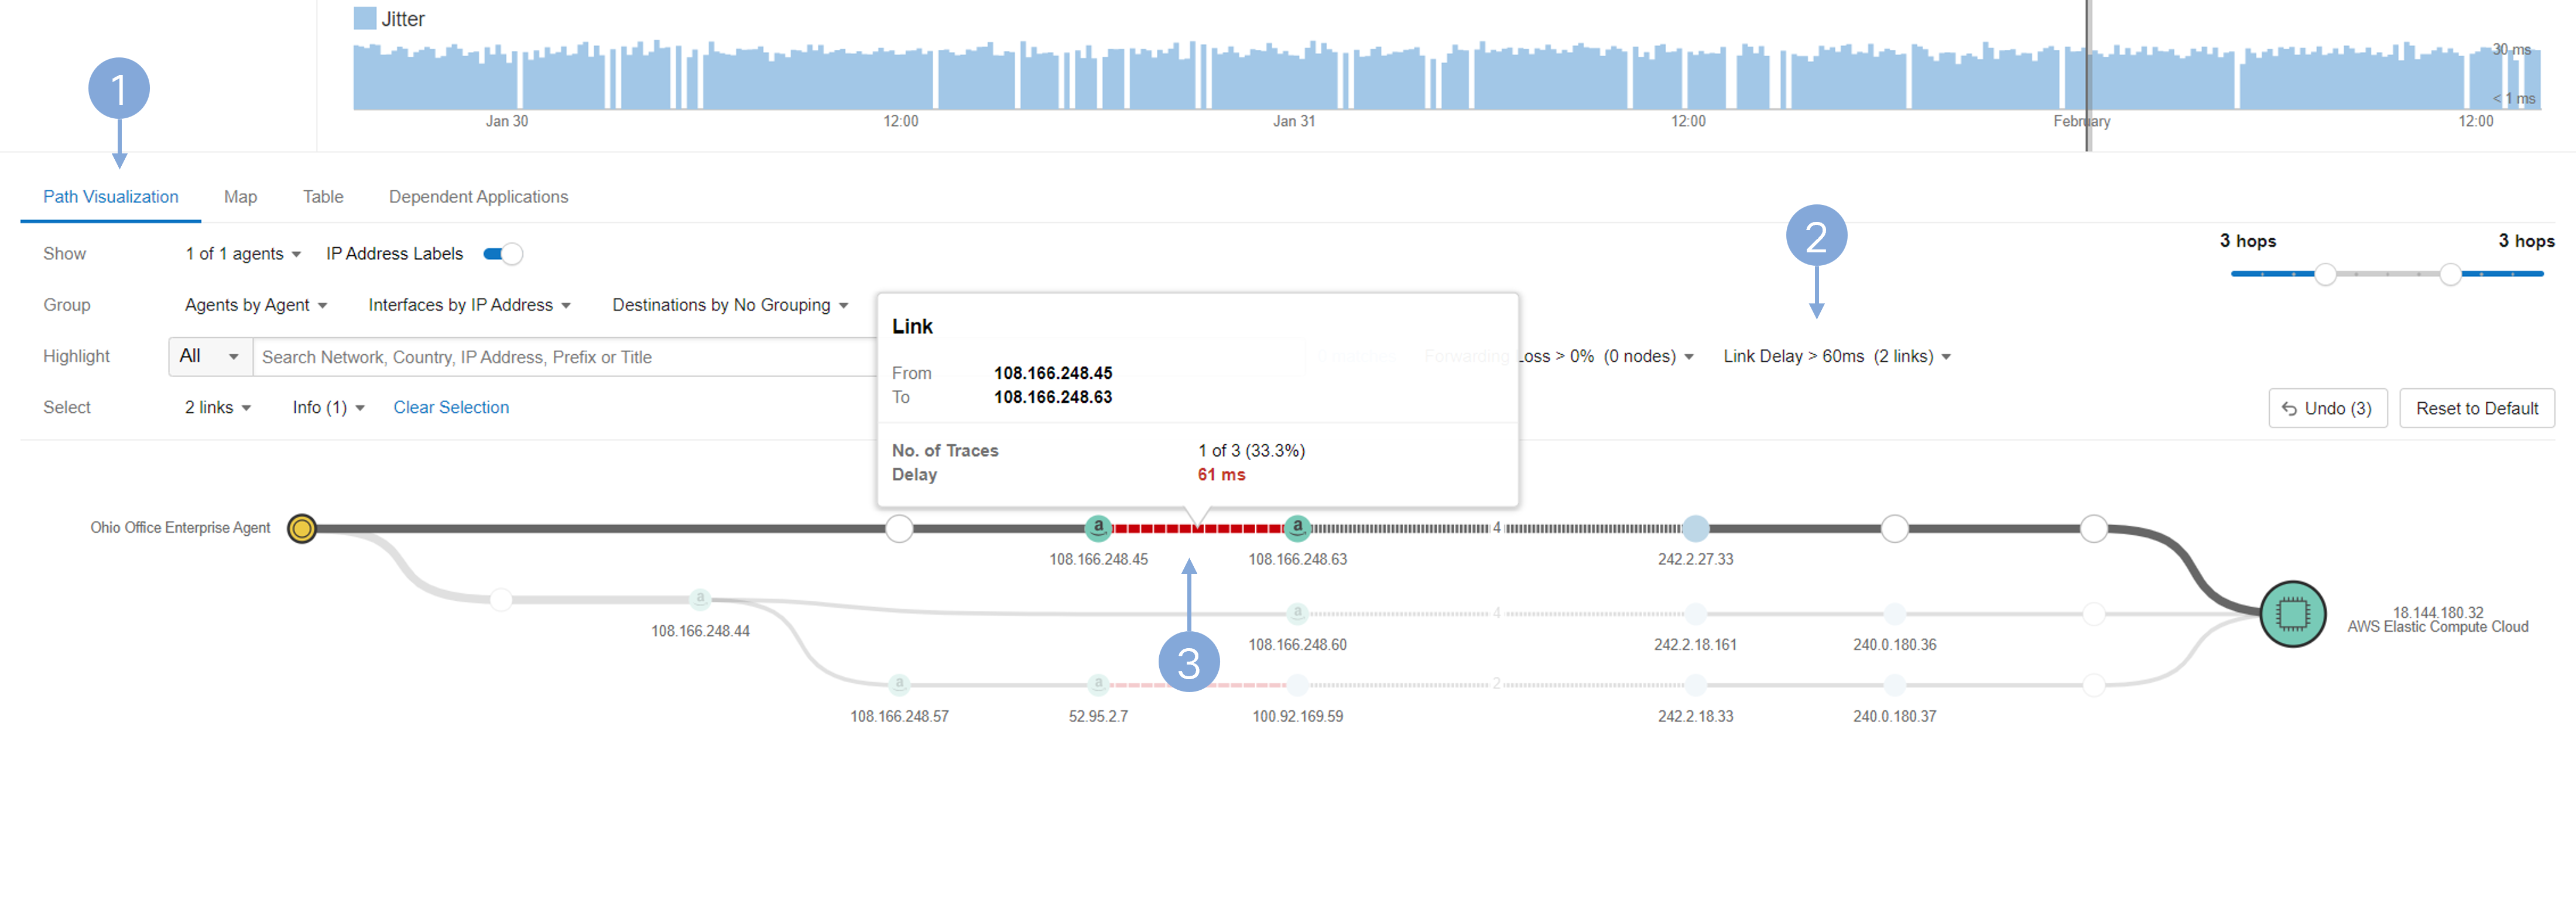
You have identified an increased delay between two network nodes, which could be a potential source of the issue.
Next, you will see how ThousandEyes and AppDynamics share data to combine troubleshooting powers.
Unified view with ThousandEyes and AppDynamics
The unified view and integration between Cisco ThousandEyes and AppDynamics offer a cohesive platform for monitoring and diagnosing digital experiences across networks and applications.
Use the credentials as described in login to AppDynamics, to access the AppDynamics controller.
Browser Real User Monitoring (BRUM) with Network Insights
The integration of Browser Real User Monitoring (BRUM) in AppDynamics with ThousandEyes Network Insights brings together the power of real-time user experience tracking with deep network performance analysis. This collaboration enables organizations to gain a comprehensive understanding of the digital experience from the browser to the backend, identifying issues and optimizing the end-to-end path for superior user satisfaction.
The integration between Cisco ThousandEyes and AppDynamics is already configured. See the steps for integrating AppDynamics with ThousandEyes here
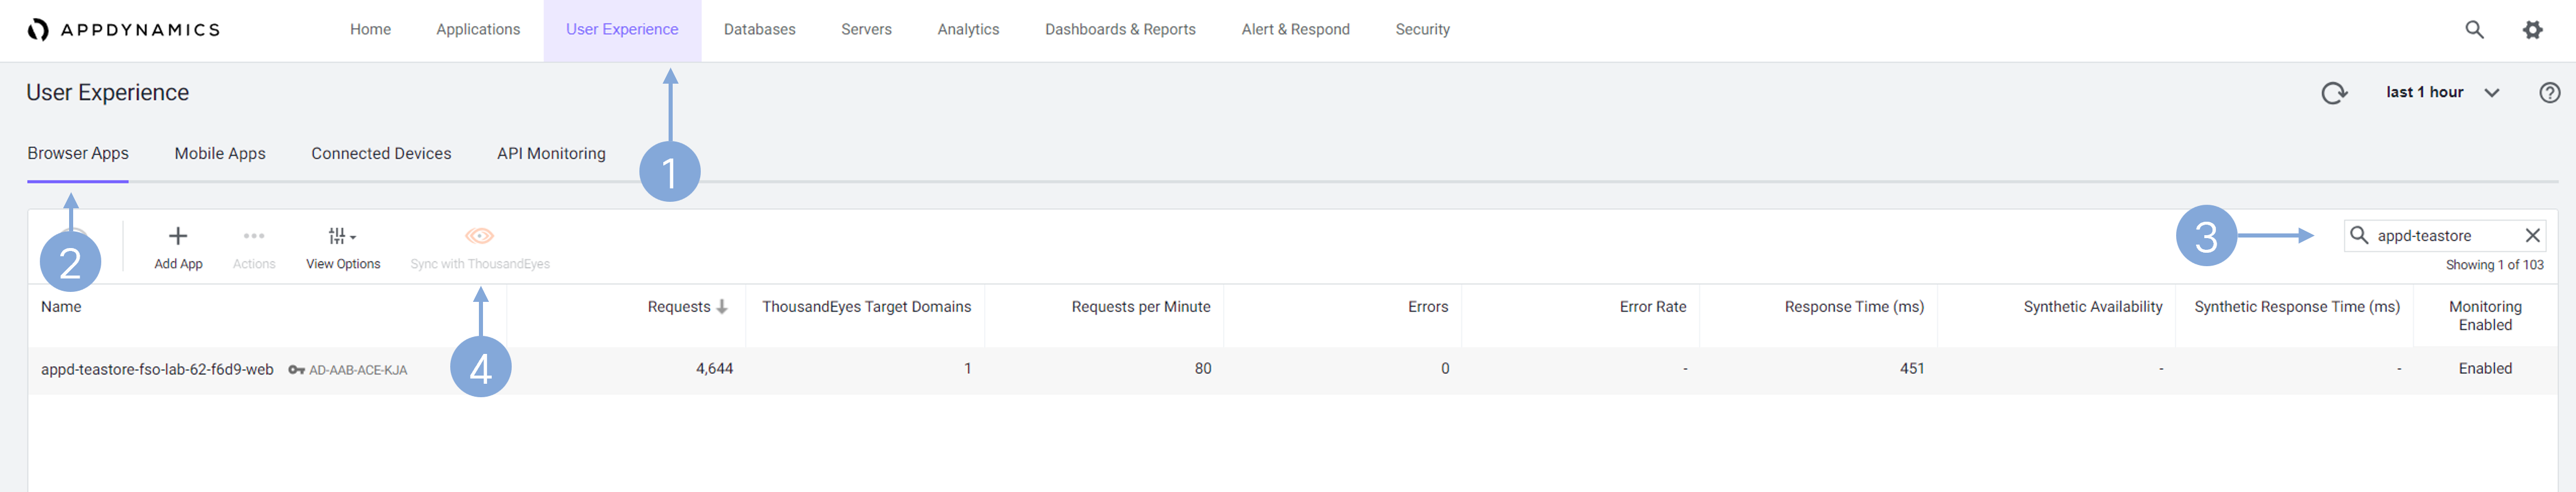
Navigate to the User Experience menu in Cisco AppDynamics.
- Click the User Experience menu.
- Make sure that Browser Apps tab is selected.
- Filter your view to a single browser app by searching for appd-teastore.
- See the Sync with ThousandEyes button.
- As a read-only user, you cannot perform the Sync.
- Double-click the browser app in the list to open the browser application dashboard.
Explore the Browser App Dashboard.
- Make sure you are in the Overview tab within the dashboard menu.
- Inspect the real-user response times.
- The ThousandEyes network insights widget is available for viewing the network performance.
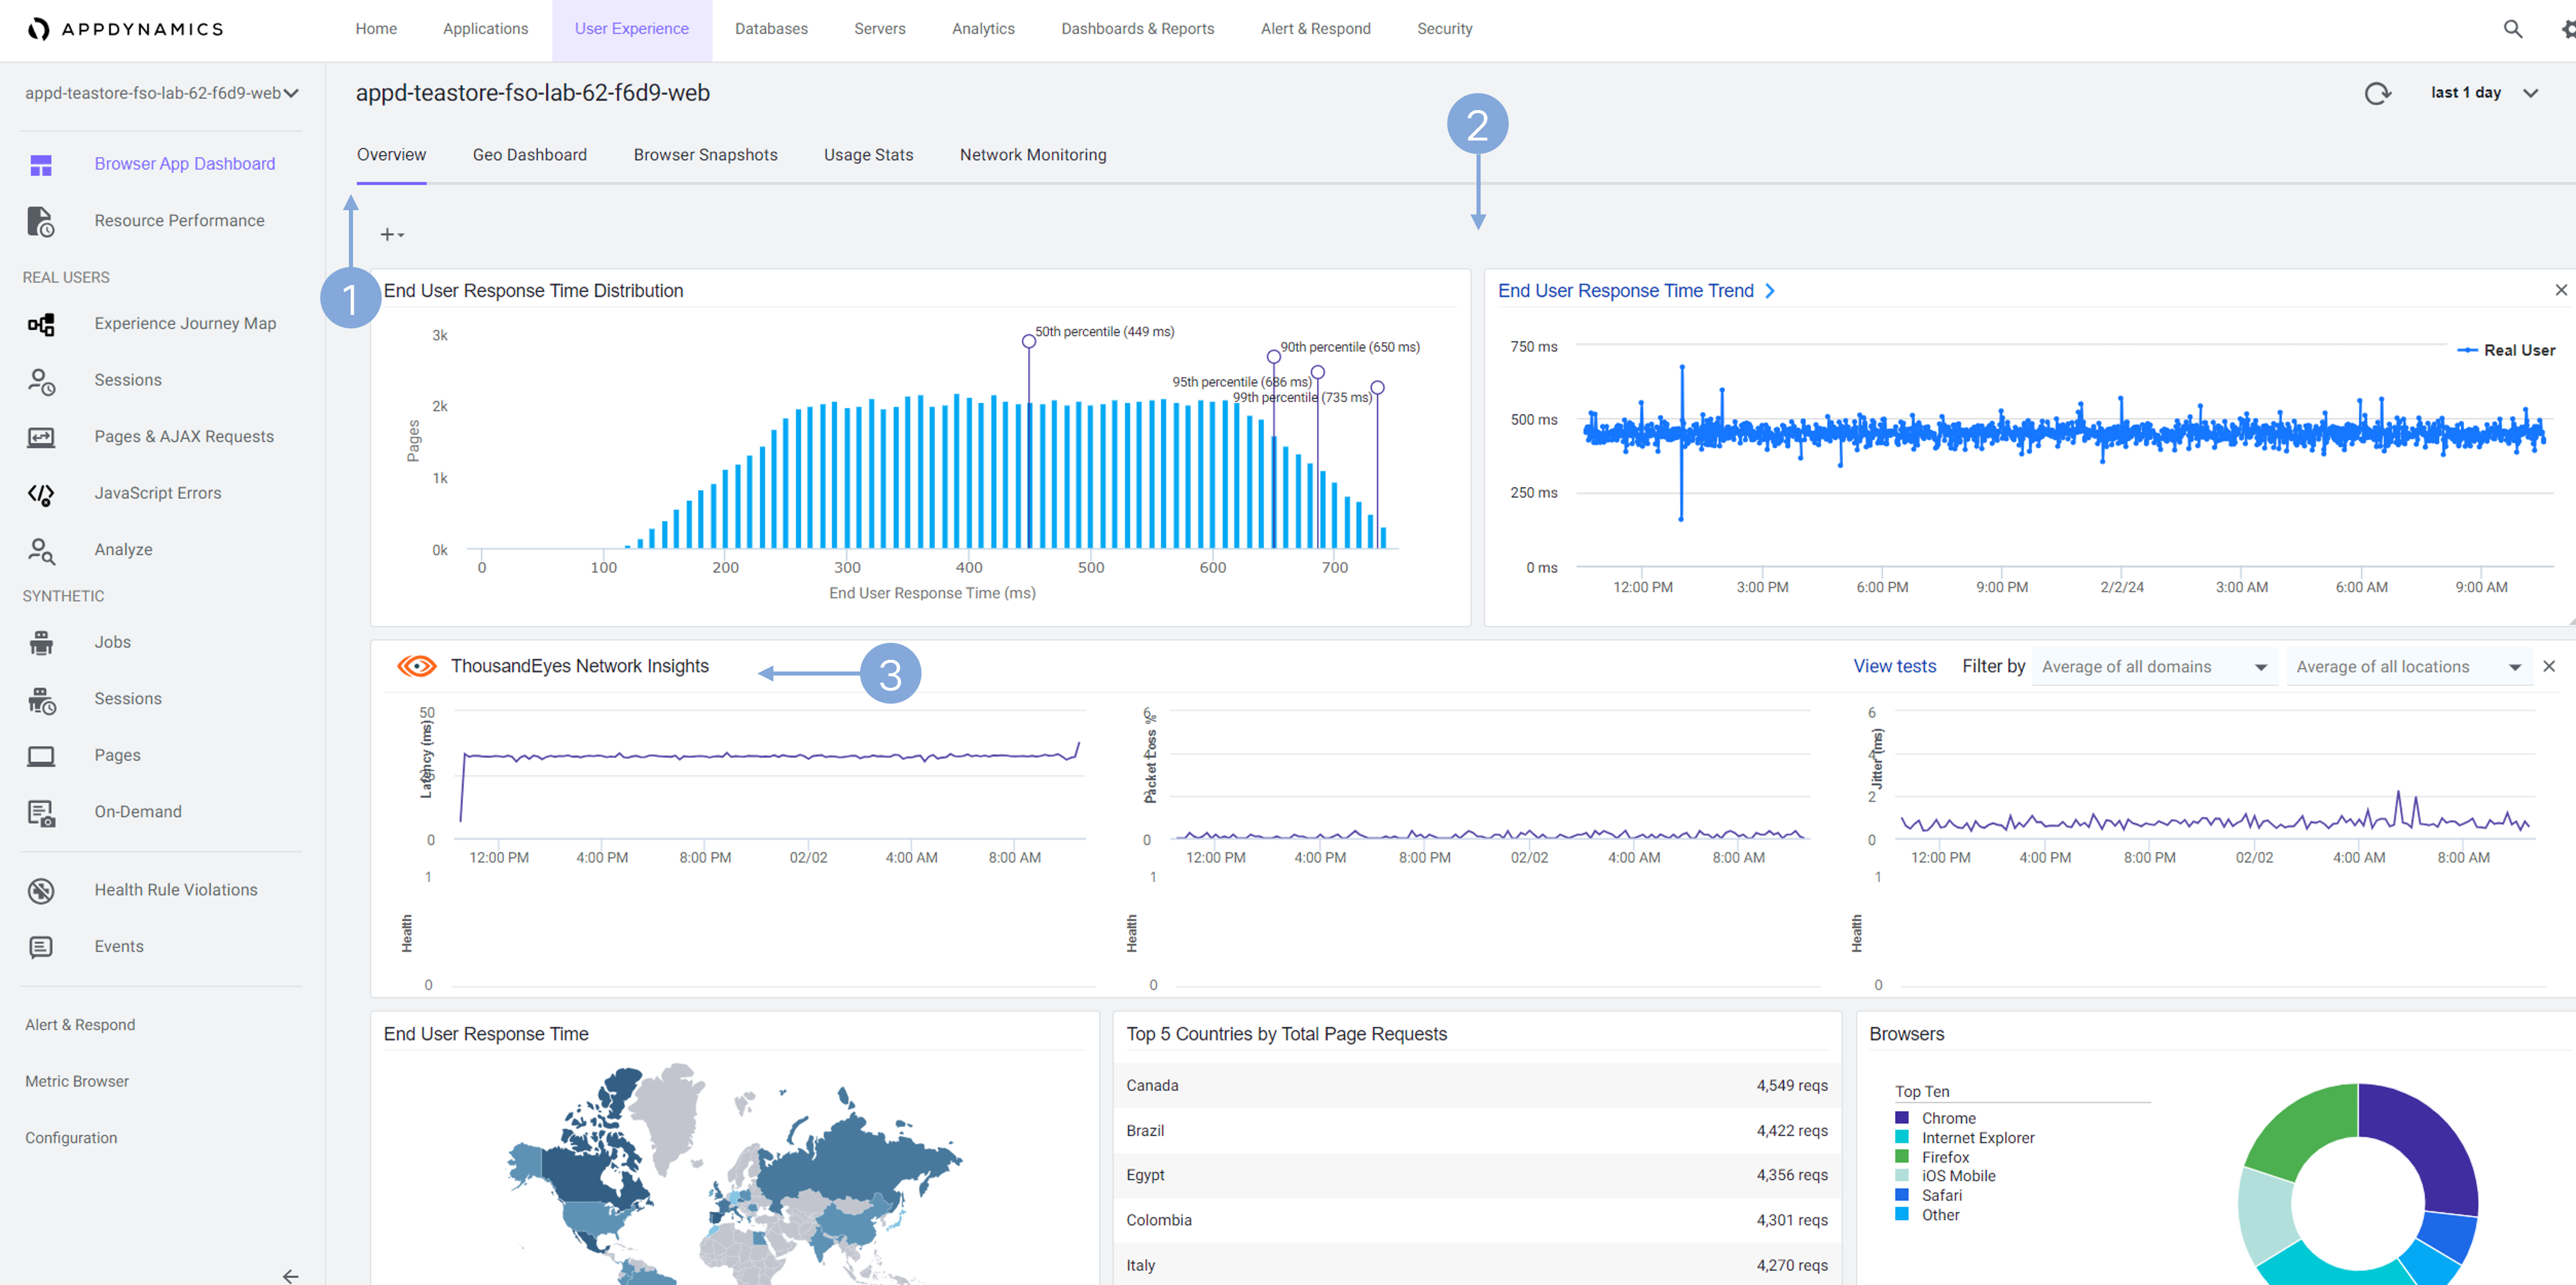
Browser Real User Monitoring (BRUM) in AppDynamics delivers insights into actual user interactions with your website, offering a glimpse into their digital experience, unlike synthetic tests. However, it doesn’t cover network performance details. Integrating with ThousandEyes fills this gap by providing additional Network Insights, allowing you to access network test data without having to exit the platform.
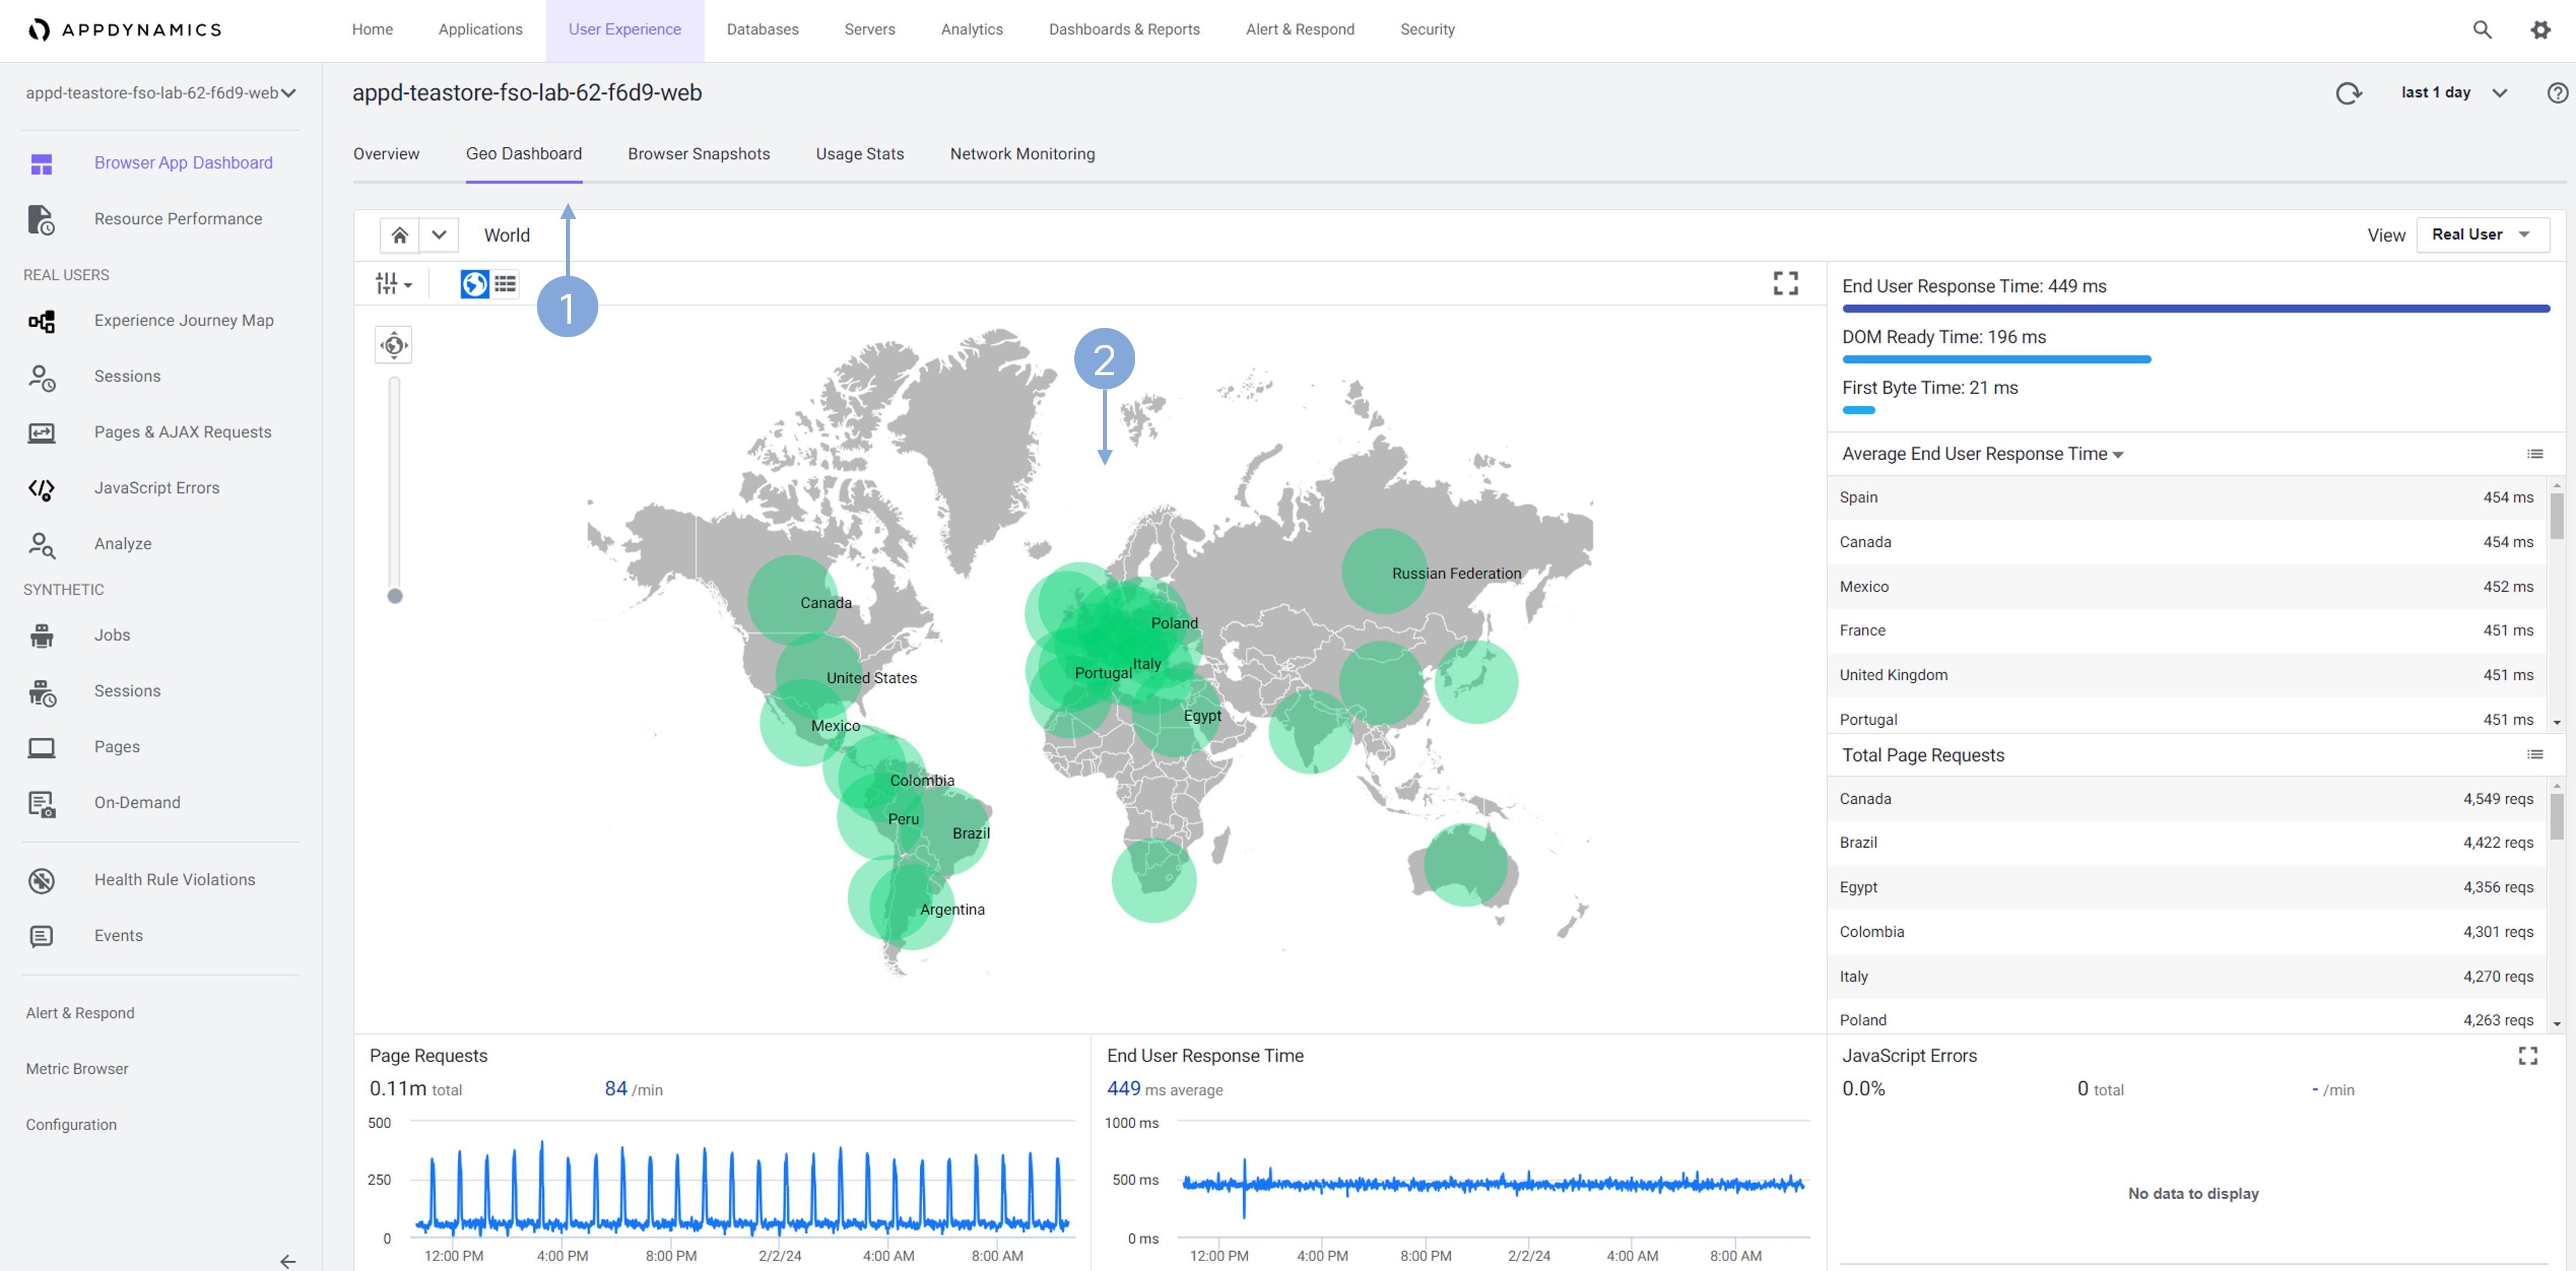
Explore the Geo Dashboard.
- Click the Geo Dashboard tab.
- Inspect the map and see where the application users are coming from.
Explore Browser Snapshots.
- Click the Browser Snapshots tab.
- Find a snapshot that has some Resource Timing data in the 4th column.
- You can click the 4th column header to sort the data.
- Select one of the snapshots and click Details
- Or double-click the snapshot.
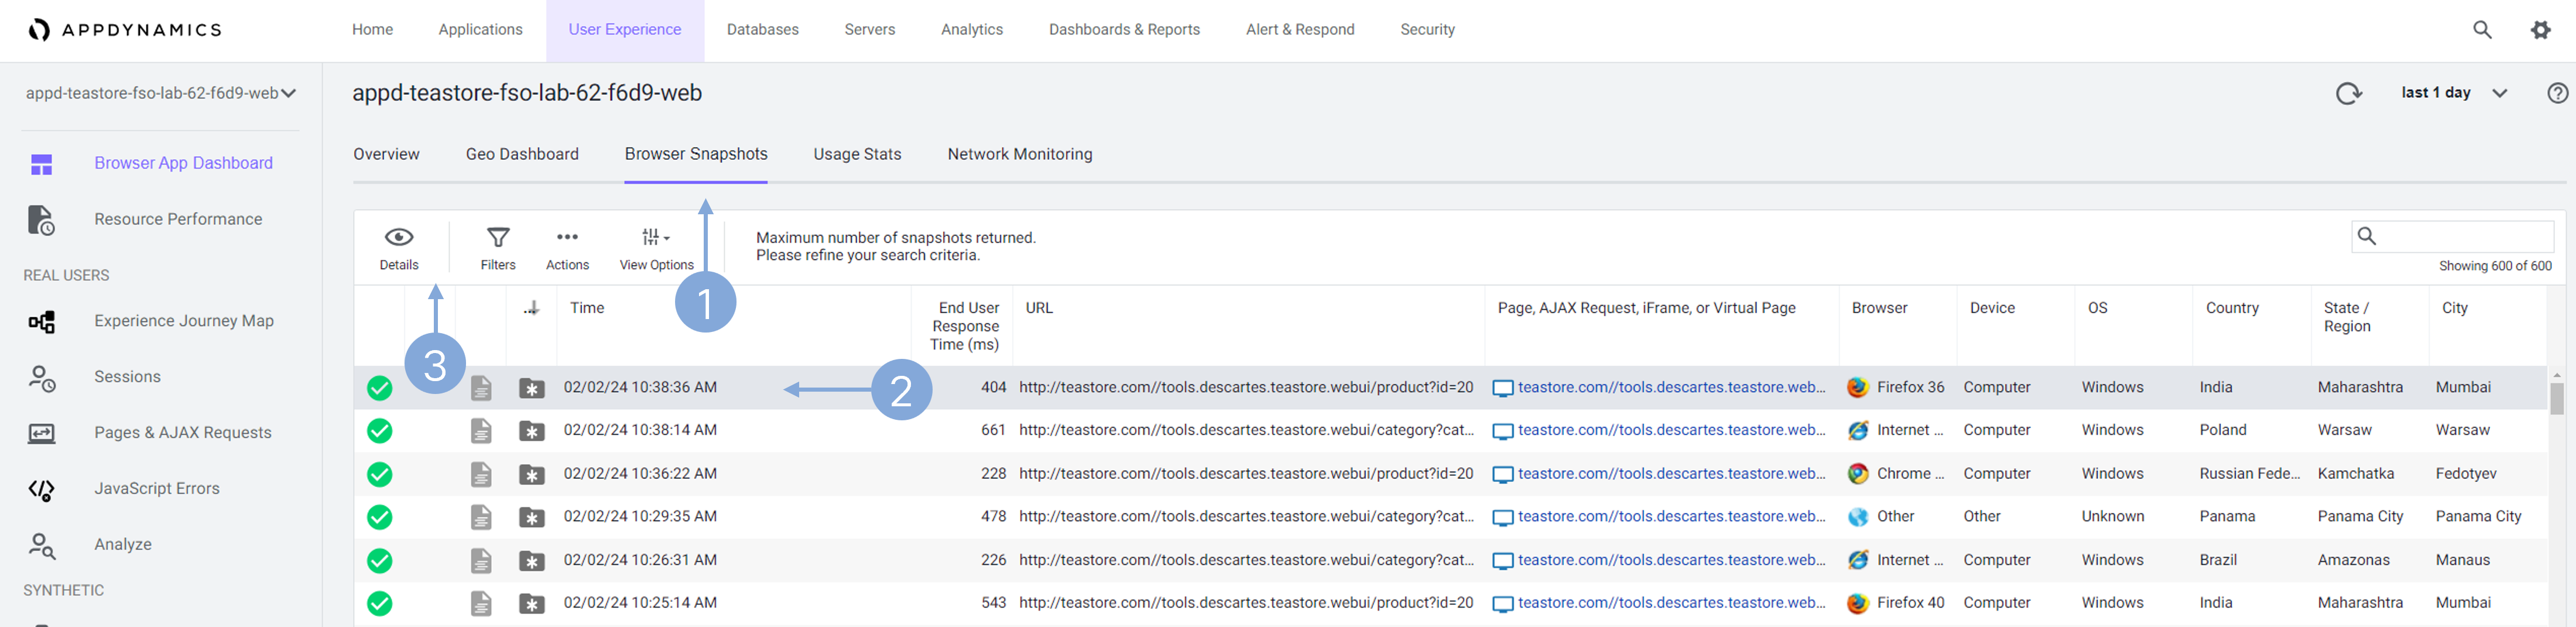
Browser snapshots in Cisco AppDynamics capture specific user session details, providing real-time insights into user experience and website performance issues.
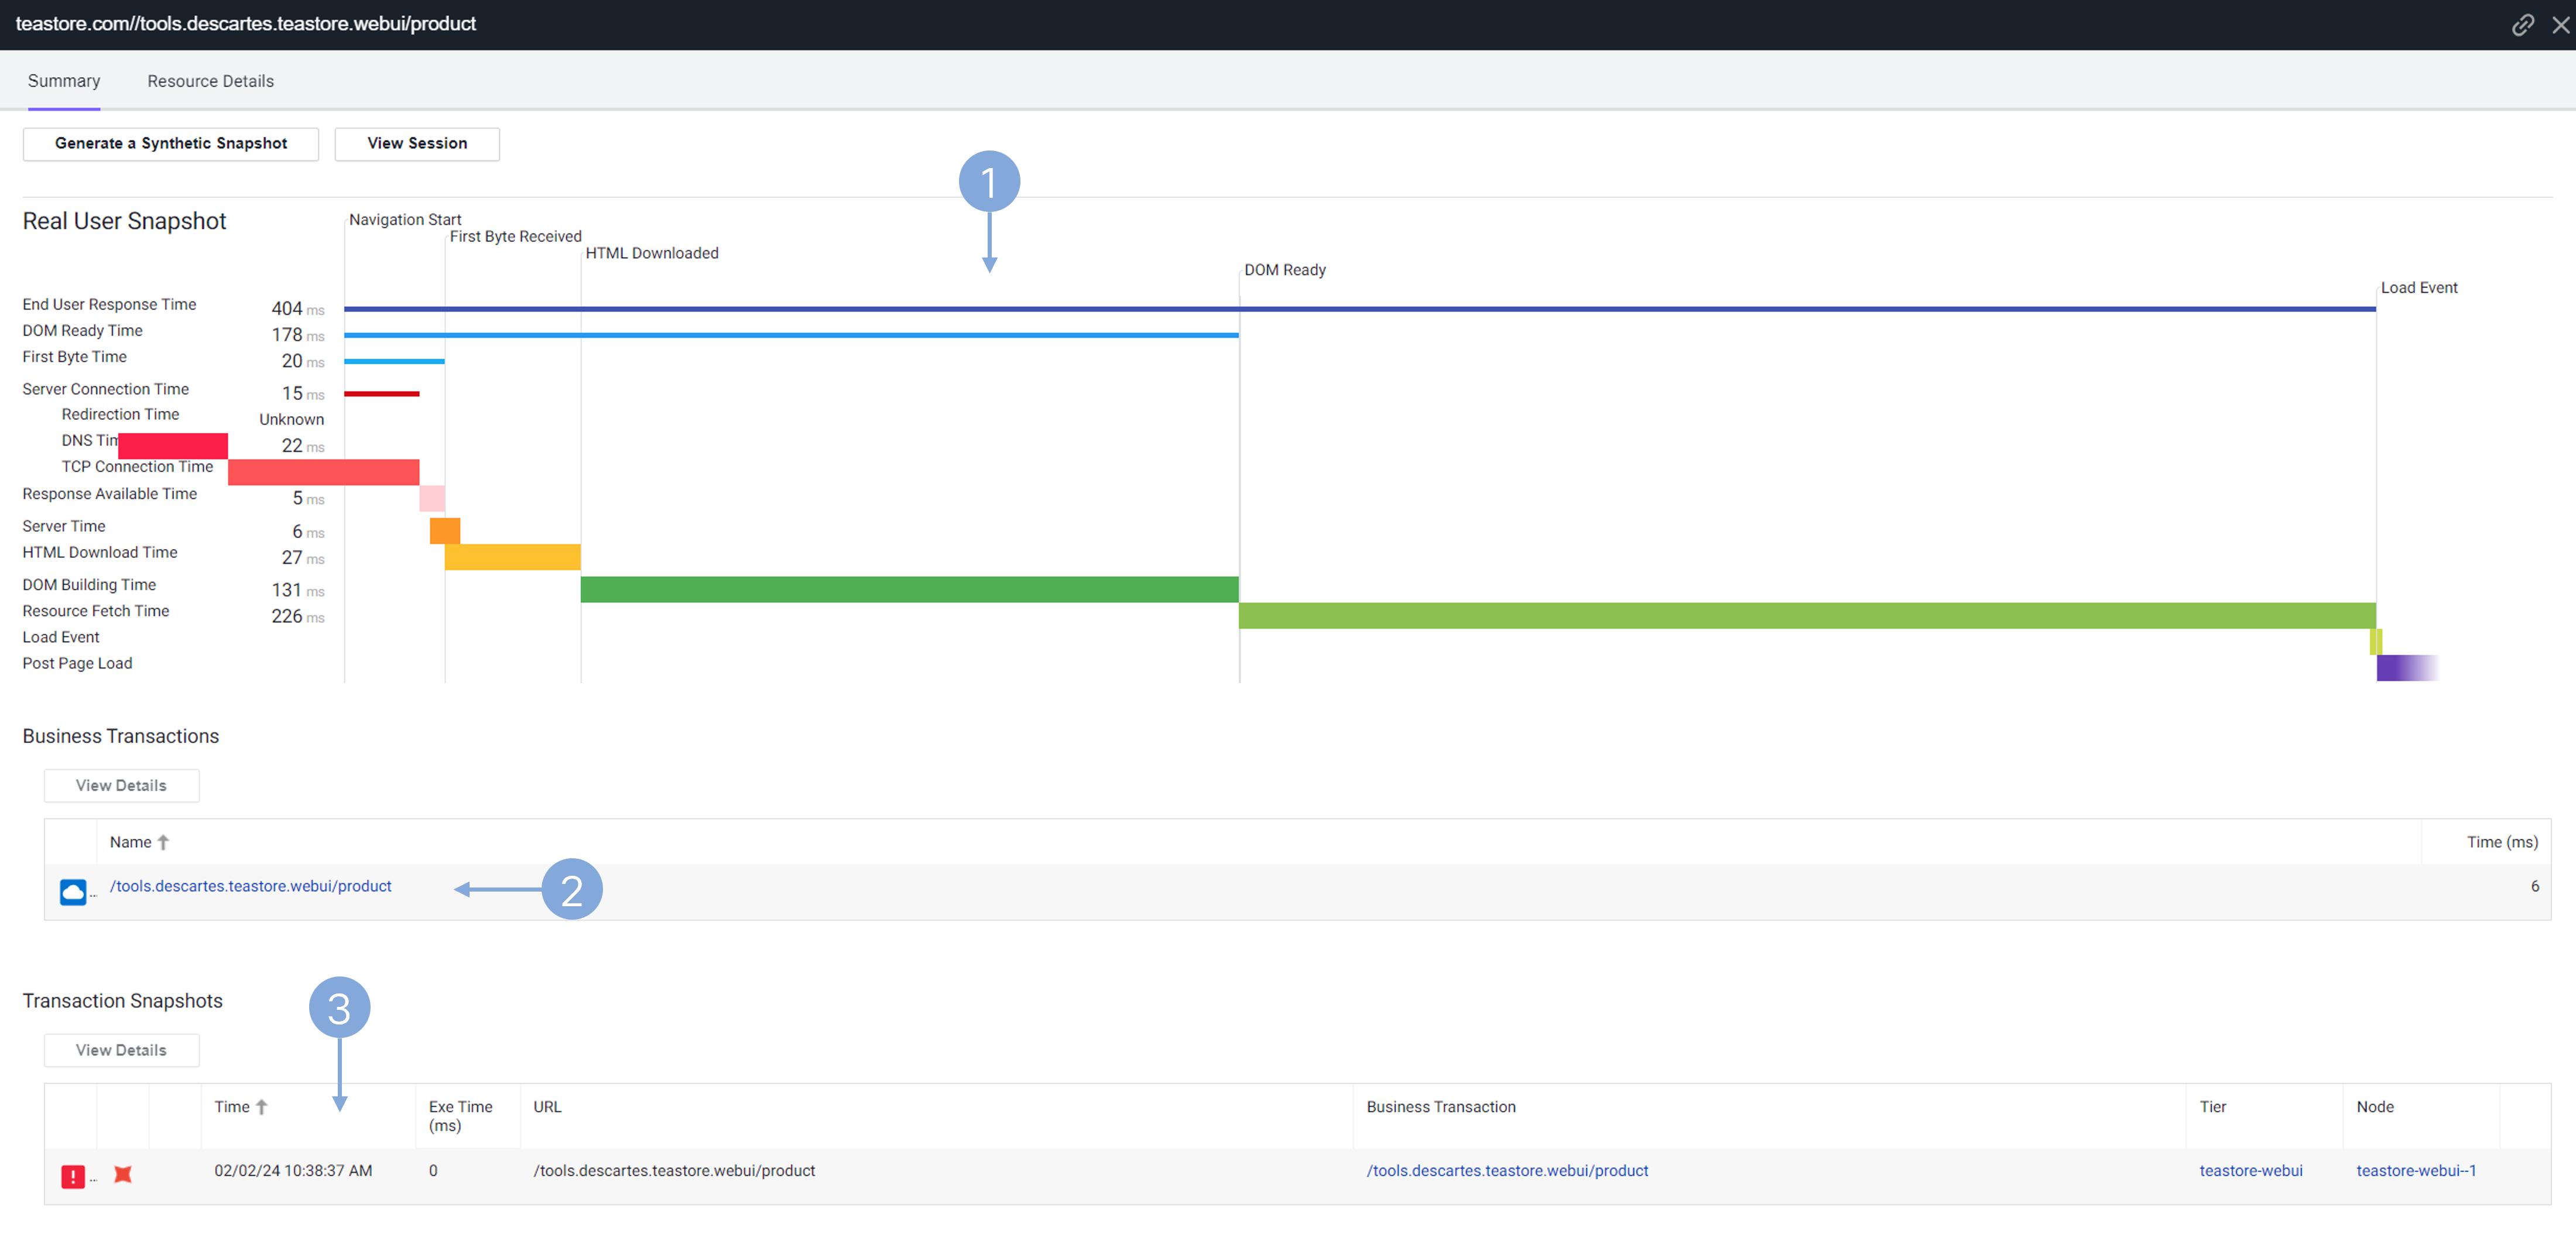
Observe the Browser Snapshot.
- Inspect the Waterfall Graph of the overall transaction timing for the page. You can hover over each of the metrics to see a popup definition for that metric.
- Under Business Transactions, an associated Business Transaction is listed, indicating a connection to the Application Performance Management (APM) aspect of AppDynamics.
- If you don’t see a Business Transaction snapshot, go back and try selecting another Browser Snapshot.
- Double click the Business Transaction Snapshot.
Observe the Business Tranasction Snapshot.
- Inspect the Business Transaction Snapshot Overview. You can see the association between the Browser Application, and an application backend service, in this case teastore-webui service.
- Under Potential Issues, you can see that there was a HTTP 500 error, indicating a problem with the server.
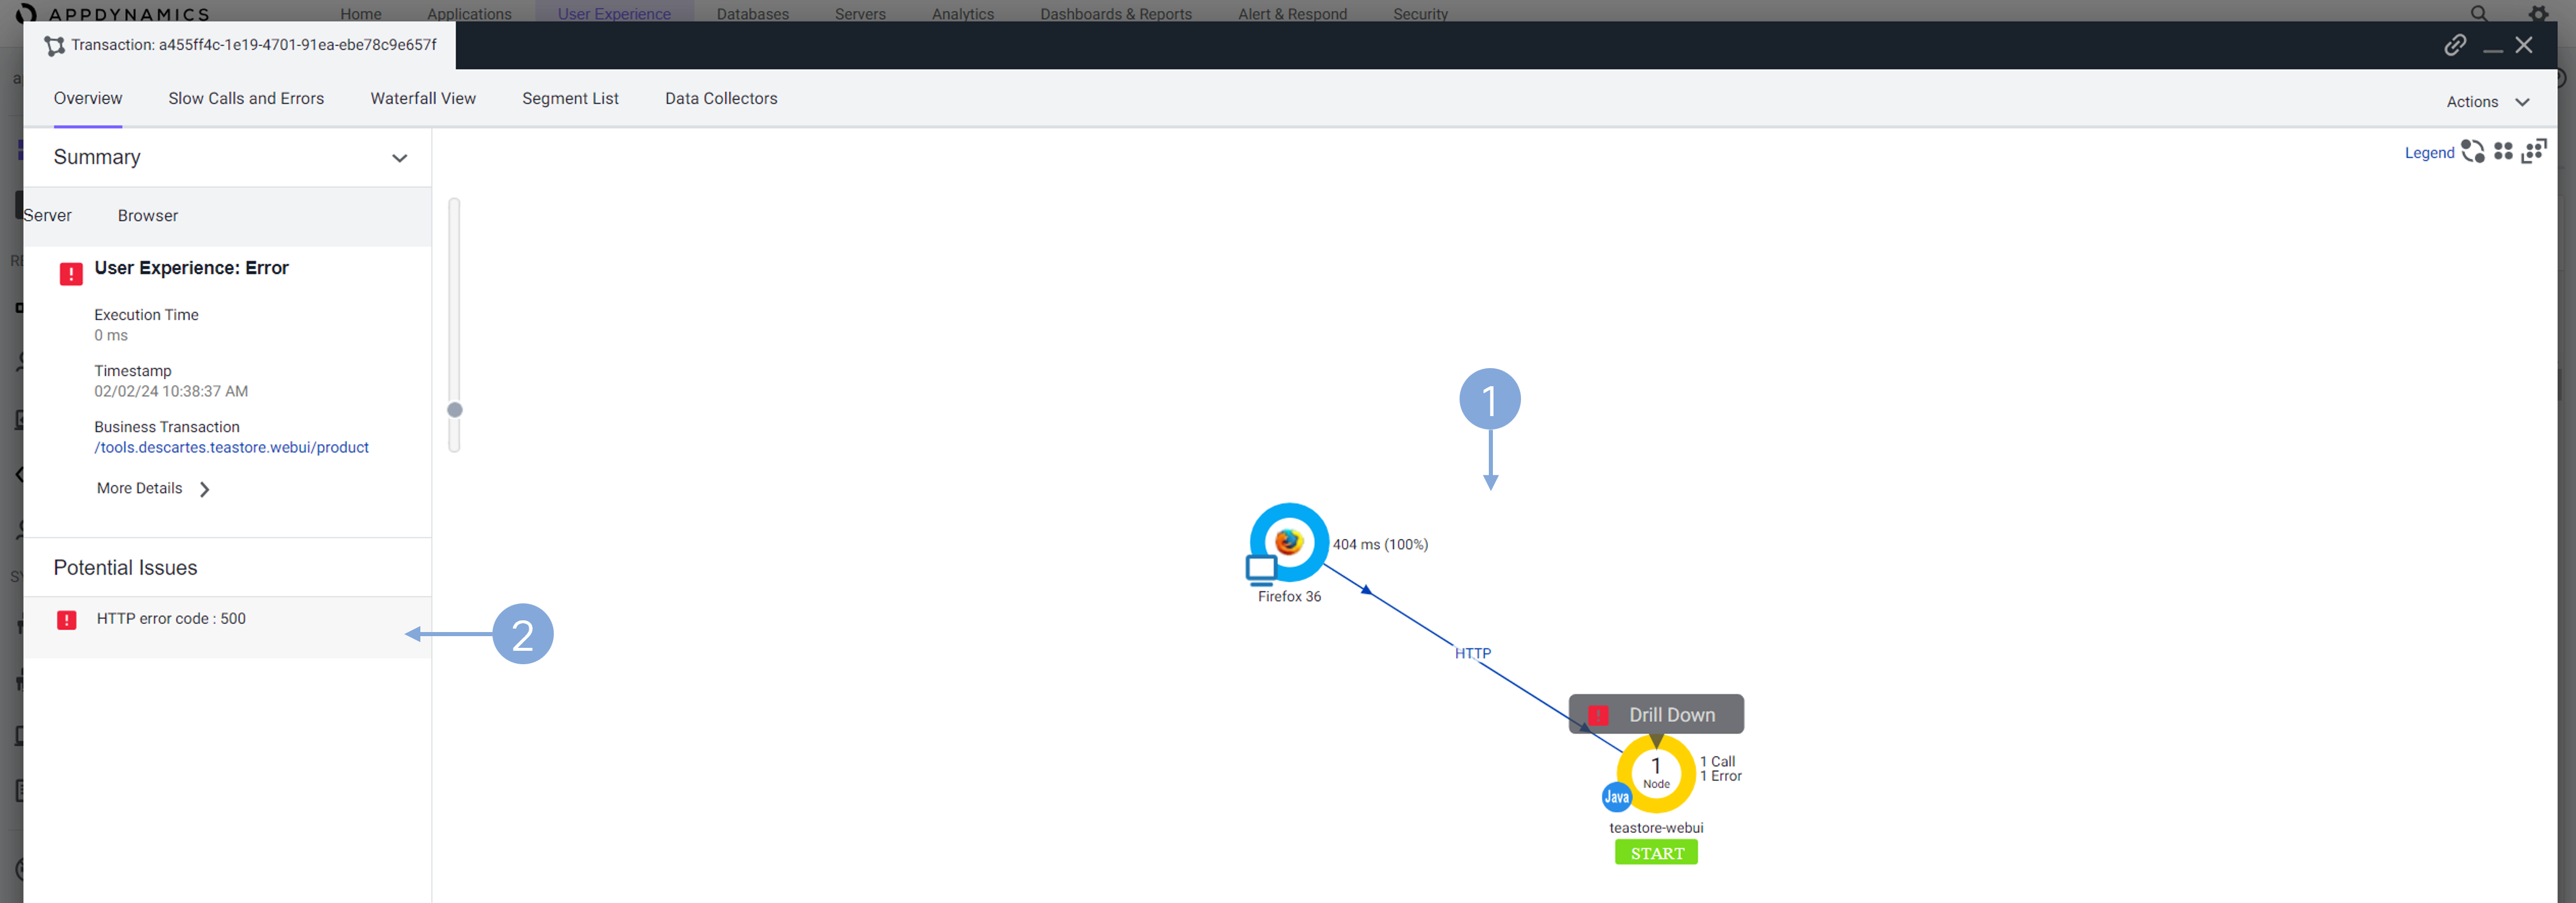
Correlating browser monitoring data with APM within AppDynamics enhances diagnostic precision and efficiency by integrating user experience insights with application performance analysis on a single platform.
Note: During an actual troubleshooting process, you would delve further into the application level to identify the root cause. However, for brevity in this scenario, we’ll conclude here, encouraging you to explore the options independently.
AppDynamics Dash Studio with ThousandEyes Network Insights
AppDynamics Dash Studio, integrated with ThousandEyes Network Insights, offers a dynamic visualization platform for merging application performance and network diagnostics in one comprehensive view.
Navigate to AppDynamics Dash Studio.
- Click Dashboards & Reports.
- Select Dash Studio tab.
- Double-click the teastore-fso dashboard.
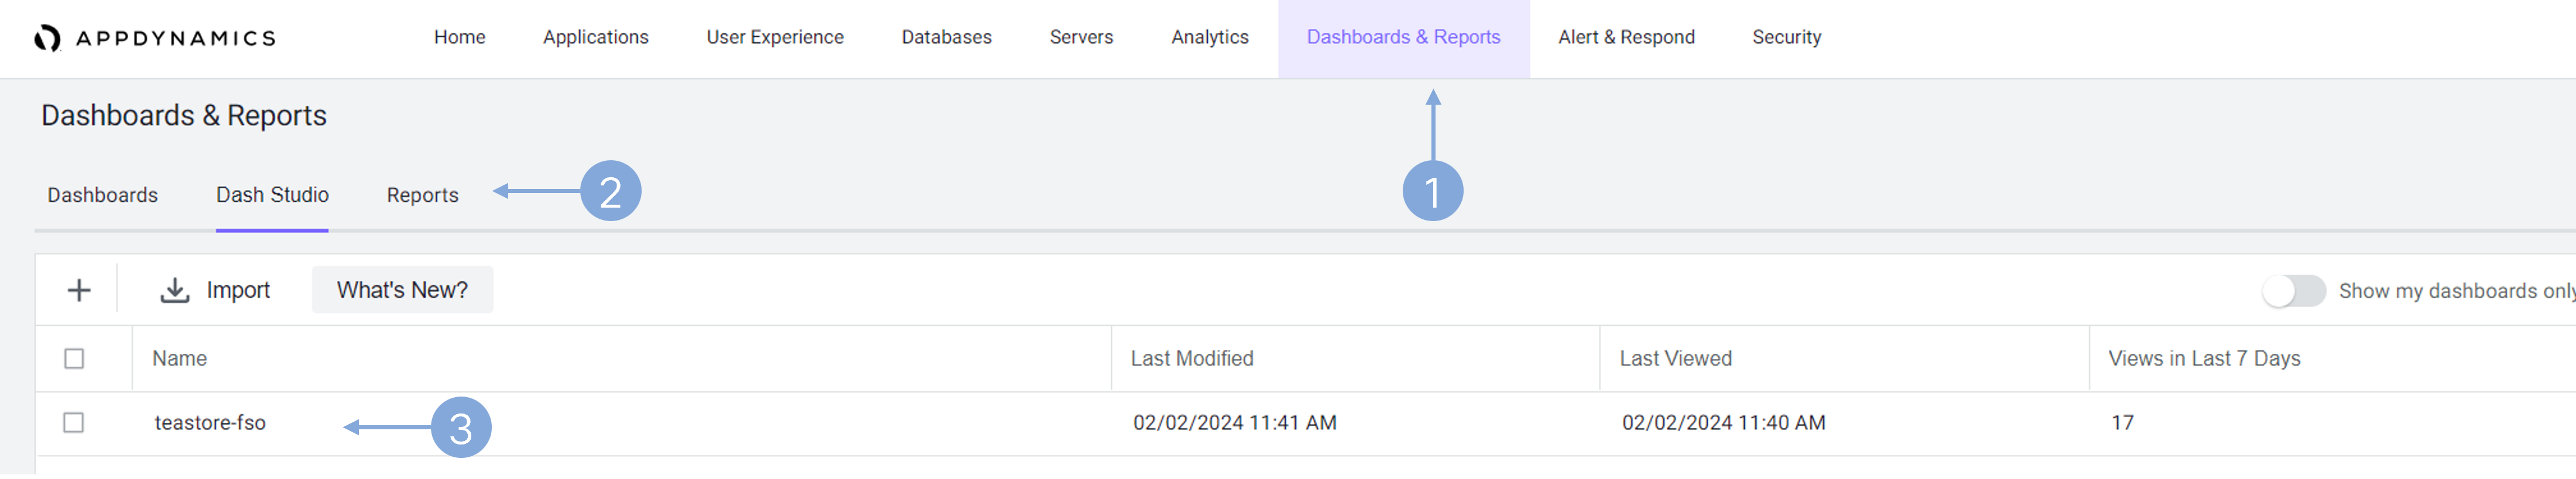
Note: This dashboard is shared among students, so it may already contain some data.
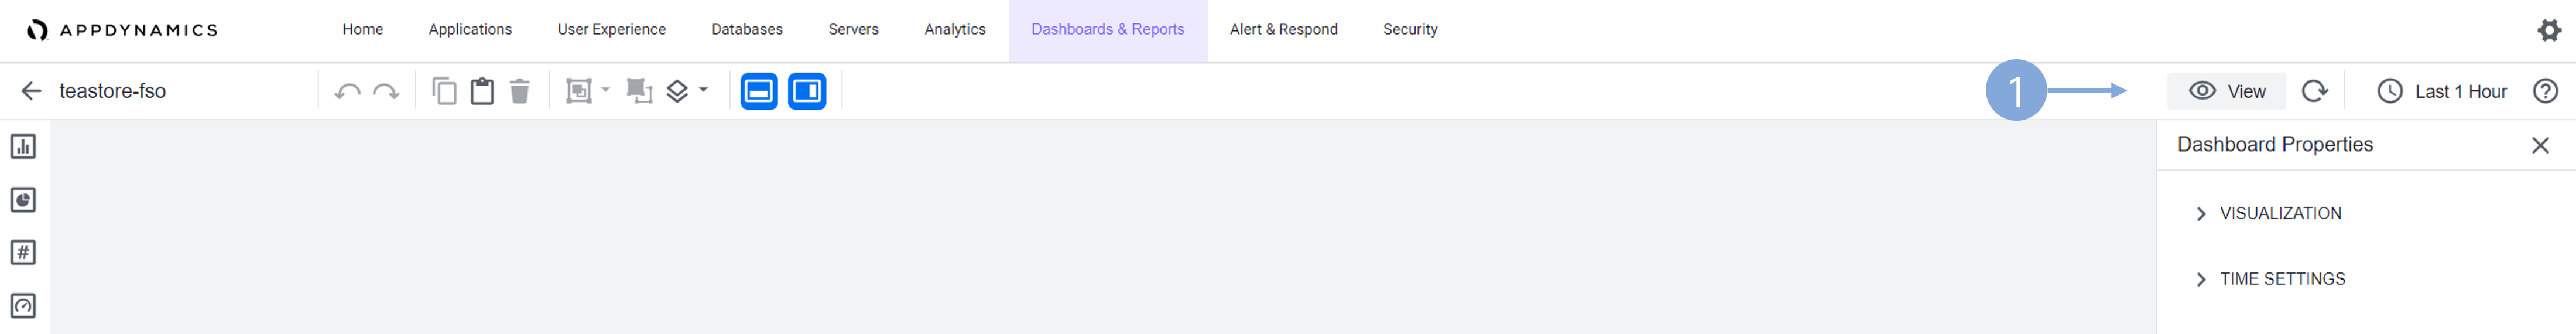
Enter the edit mode.
- Switch between View and Edit mode with a button on the top-right of the dash studio.
- You are in the edit mode if you see the dashboard widget options and properties.
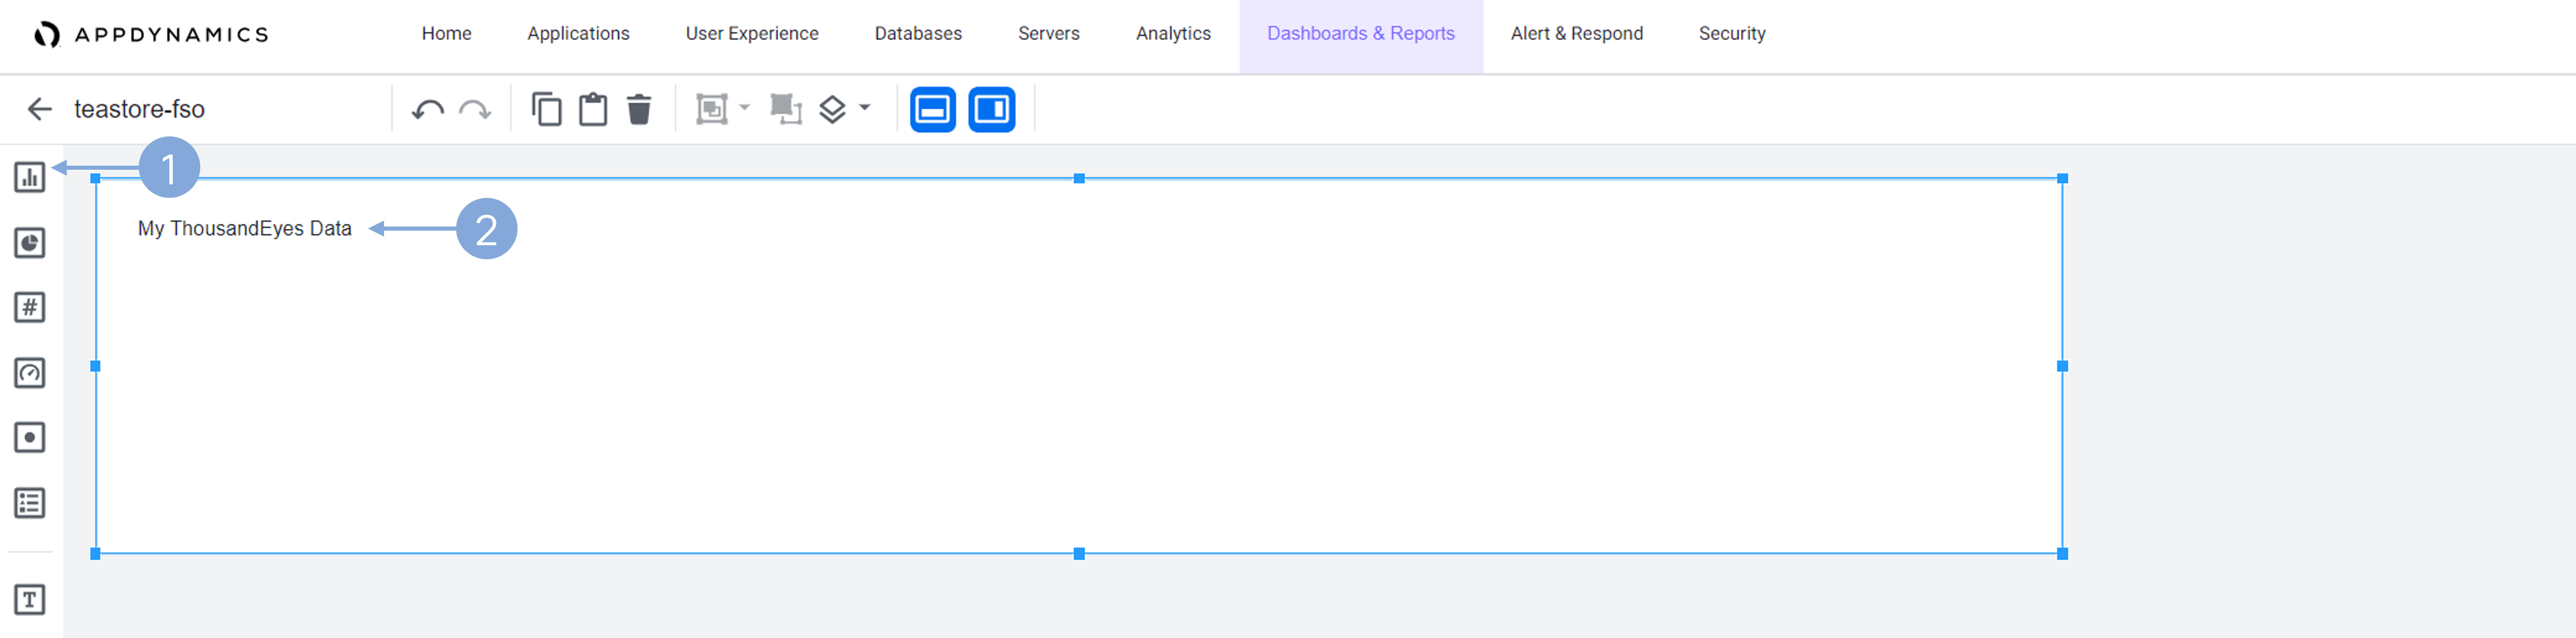
Add a new Time Series graph.
- Click the first icon to add a new Time Series graph.
- Change the name of the widget heading.
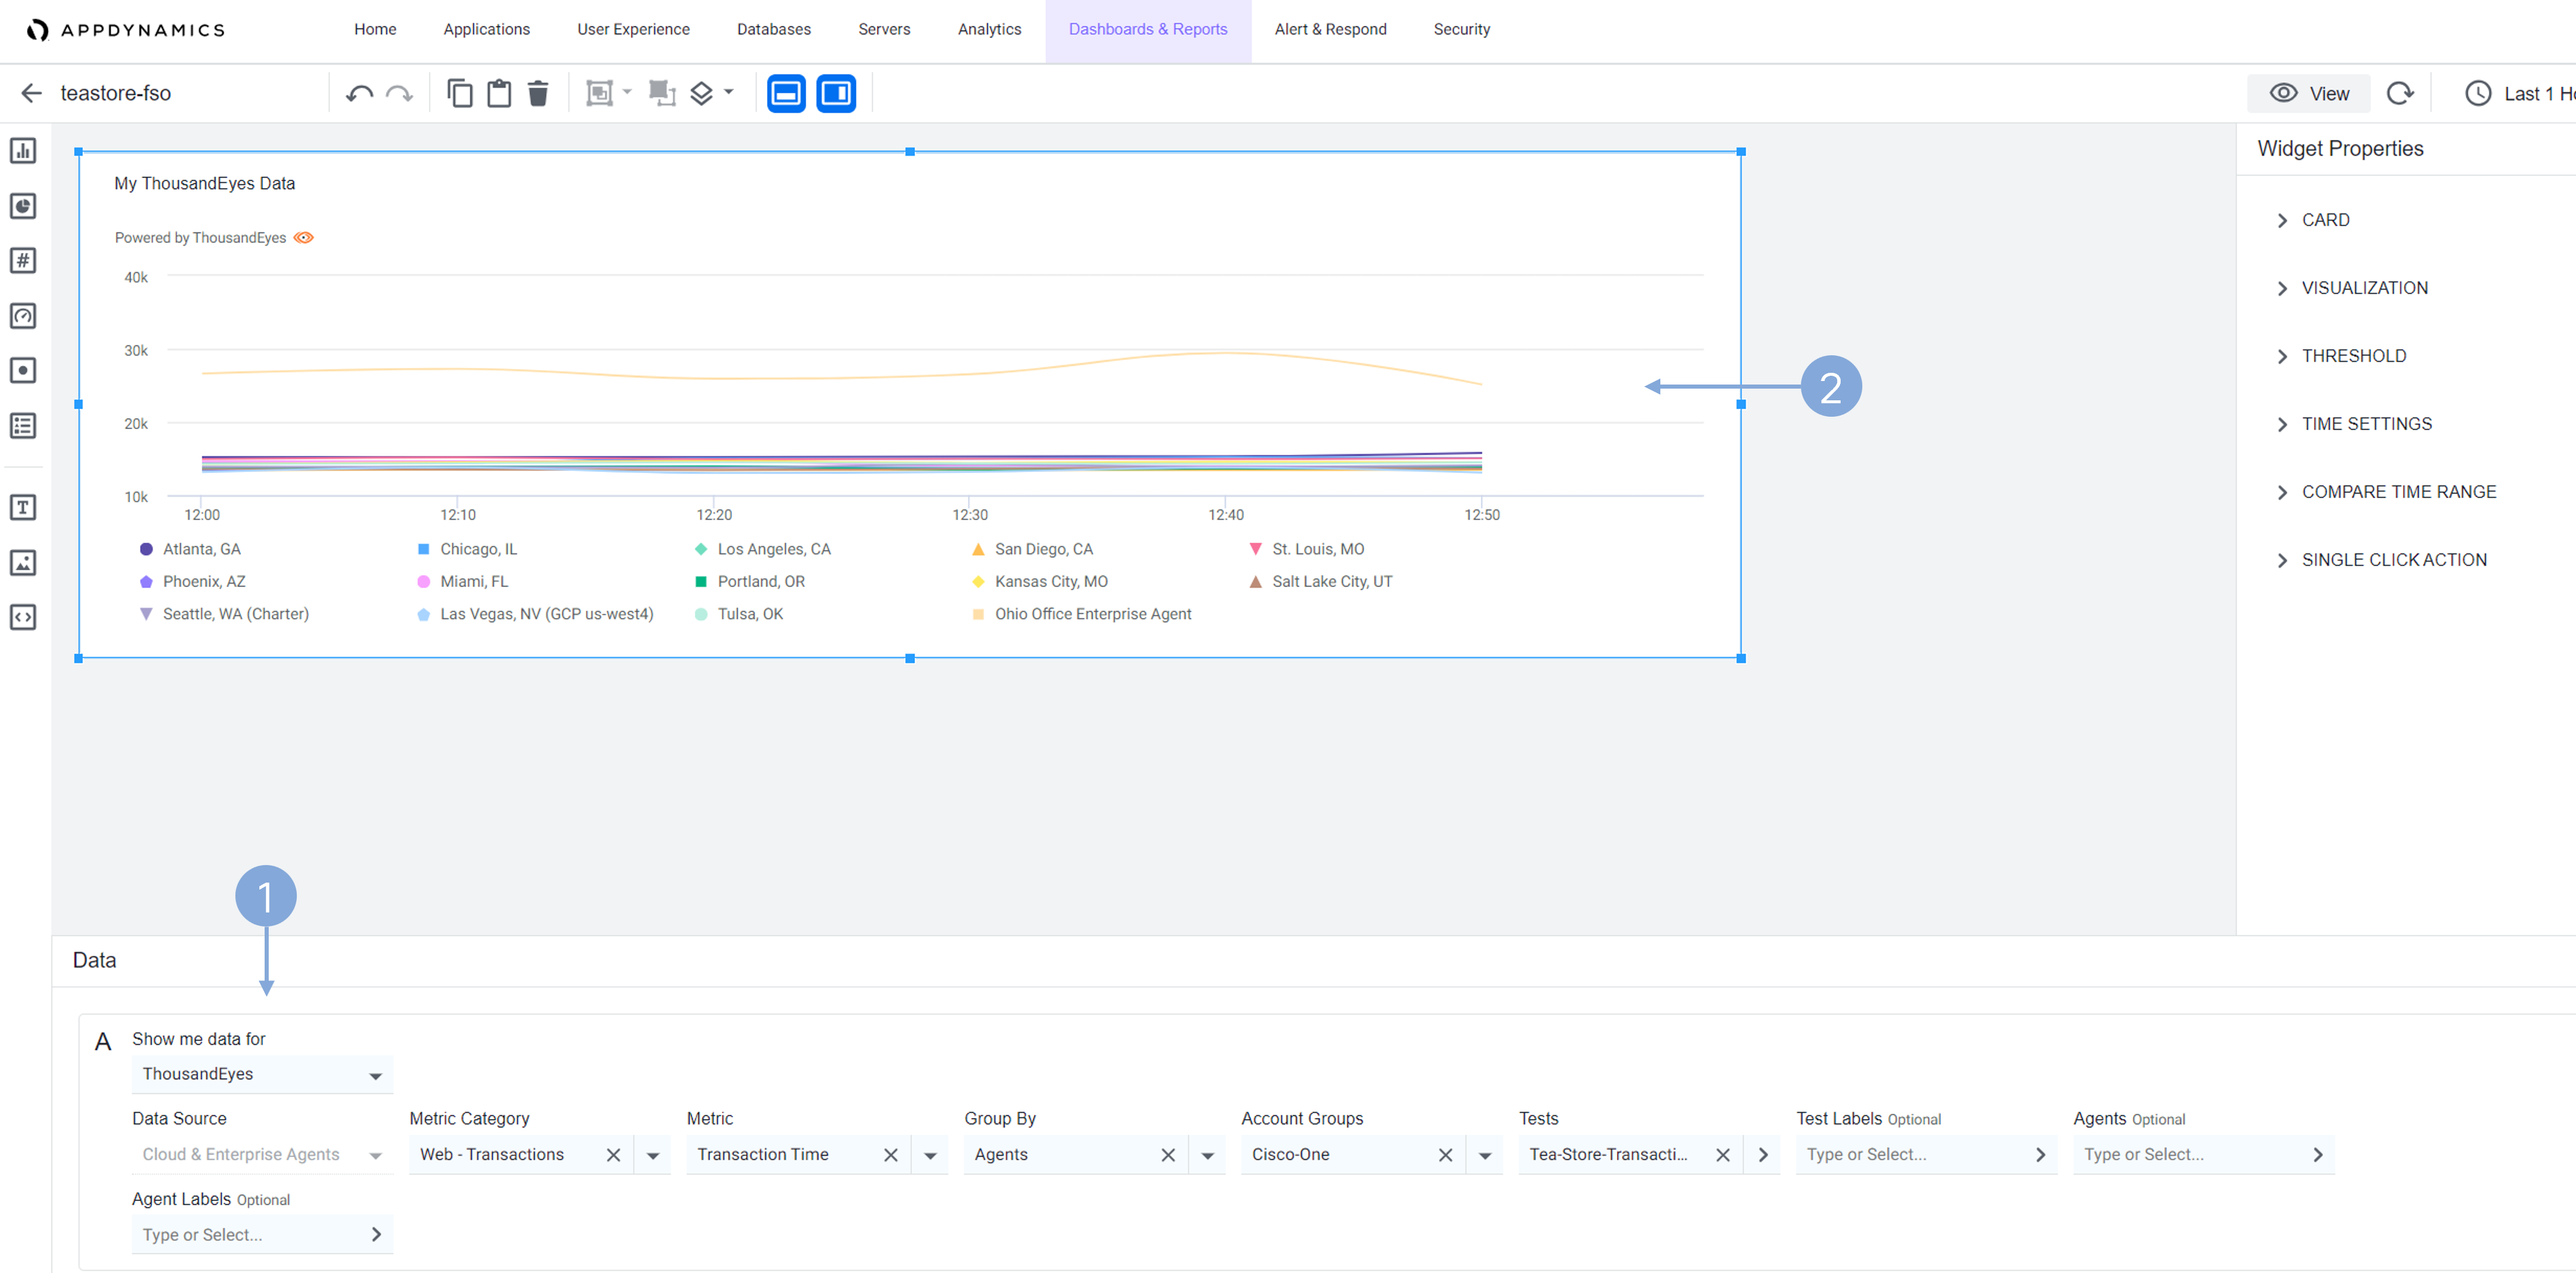
Configure the Time Series graph with ThousandEyes data.
- From the drop-down menu, select ThousandEyes as the data source for the widget. Use the following values for the data source:
- Metric Category: Web - Transactions
- Metric: Transaction Time
- Group by: Agents
- Account Groups: Cisco-One
- Tests: Tea-Store-Transaction-LT
- Observe the ThousandEyes widget. Which location is experiencing the slowest transaction times?
Next
We’ll take a look at the application from an operations viewpoint in the Application Dependency Monitoring use case.